Introduction
Most people will invest in equities at some point, unless you are someone who doesn’t believe in equities and will put your savings in the bank for principal sum assurance. The brokerage system that you order the stocks should have a portfolio in-built that helps you keep track of your holdings. For a novice trader like me, who only understands simple terms like P/E, ROI, and Yield, I have to choose from a few hundred stock options. I therefore developed a stock picker that will assist me in identifying and shortlisting the top five stocks that are likely to be suitable for long-term investment.
Background
I was interested in investing in stock market, but I was not interested in analyzing candlestick charts or watching videos on how to pick long-term equity investments. The brokerage system I was using can make a full list of available stocks with column headers like PE, Yield, and ROI, so I studied each of them, but only enough to know which one should be higher or lower. That’s when I decided to write my own grading system. The goal is to find stocks that are healthy for most of the parameters.
Prerequisites
A Linux machine that runs LAMP or LEMP:
- Linux machine
- Apache or Nginx web-server
- MySQL or MariaDB database
- PHP (or PHP-FPM with Nginx)
- Simple HTML and Bootstrap CSS
Step 1 – Create MySQL Database
There are three tables:
- stocks – stores all the available stocks and their investing metrics from the market.
- portfolio – table has two extra columns (sector, industry) to store the sectors, which could be further categorized into industries.
- options – stores notes for your stock-related tasks, events, or actions, but it is built in a way that future features can be added easily.
--
-- Database: `stock_picker`
--

-- --------------------------------------------------------

--
-- Table structure for table `options`
--

CREATE TABLE `options` (
  `option_name` varchar(255) NOT NULL,
  `option_value` text NOT NULL,
  `lastupdate` datetime NOT NULL
) ENGINE=InnoDB DEFAULT CHARSET=utf8mb4;

-- --------------------------------------------------------

--
-- Table structure for table `portfolio`
--

CREATE TABLE `portfolio` (
  `sector` varchar(255) DEFAULT NULL,
  `industry` varchar(255) DEFAULT NULL,
  `companyname` varchar(255) NOT NULL,
  `code` varchar(255) NOT NULL,
  `mktcap` decimal(10,3) DEFAULT NULL,
  `pe` decimal(10,3) DEFAULT NULL,
  `pb` decimal(10,3) DEFAULT NULL,
  `eps` decimal(10,3) DEFAULT NULL,
  `roi` decimal(10,3) DEFAULT NULL,
  `roe` decimal(10,3) DEFAULT NULL,
  `yield` decimal(10,3) DEFAULT NULL,
  `avgvol` decimal(10,3) DEFAULT NULL,
  `rating` decimal(10,3) DEFAULT NULL,
  `close` decimal(10,3) DEFAULT NULL,
  `last` decimal(10,3) DEFAULT NULL,
  `lastupdate` datetime NOT NULL
) ENGINE=InnoDB DEFAULT CHARSET=utf8mb4;

-- --------------------------------------------------------

--
-- Table structure for table `stocks`
--

CREATE TABLE `stocks` (
  `companyname` varchar(255) NOT NULL,
  `code` varchar(255) NOT NULL,
  `mktcap` decimal(10,3) DEFAULT NULL,
  `pe` decimal(10,3) DEFAULT NULL,
  `pb` decimal(10,3) DEFAULT NULL,
  `eps` decimal(10,3) DEFAULT NULL,
  `roi` decimal(10,3) DEFAULT NULL,
  `roe` decimal(10,3) DEFAULT NULL,
  `yield` decimal(10,3) DEFAULT NULL,
  `avgvol` decimal(10,3) DEFAULT NULL,
  `rating` decimal(10,3) DEFAULT NULL,
  `close` decimal(10,3) DEFAULT NULL,
  `last` decimal(10,3) DEFAULT NULL,
  `lastupdate` datetime NOT NULL
) ENGINE=InnoDB DEFAULT CHARSET=utf8mb4;

--
-- Indexes for dumped tables
--

--
-- Indexes for table `options`
--
ALTER TABLE `options`
  ADD PRIMARY KEY (`option_name`);

--
-- Indexes for table `portfolio`
--
ALTER TABLE `portfolio`
  ADD PRIMARY KEY (`code`);

--
-- Indexes for table `stocks`
--
ALTER TABLE `stocks`
  ADD PRIMARY KEY (`code`);
COMMIT;
Step 2 – HTML Forms
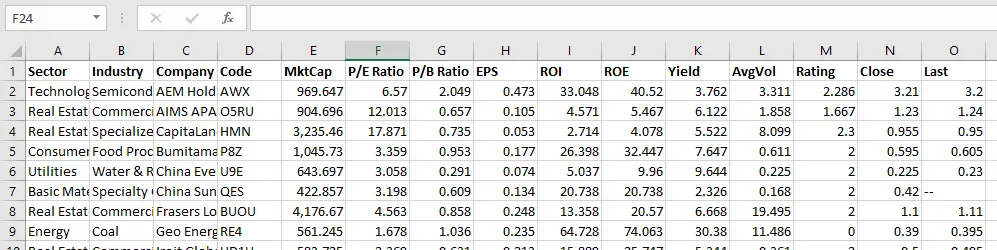
- Upload Stock List: Choose and import a CSV file into the `stocks` or `portfolio` MySQL table. Existing table data will be purged entirely because some stocks may be delisted from the exchange, which makes it easier to do
INSERTthanUPDATEnew data. - Write Notes: Show your notes in
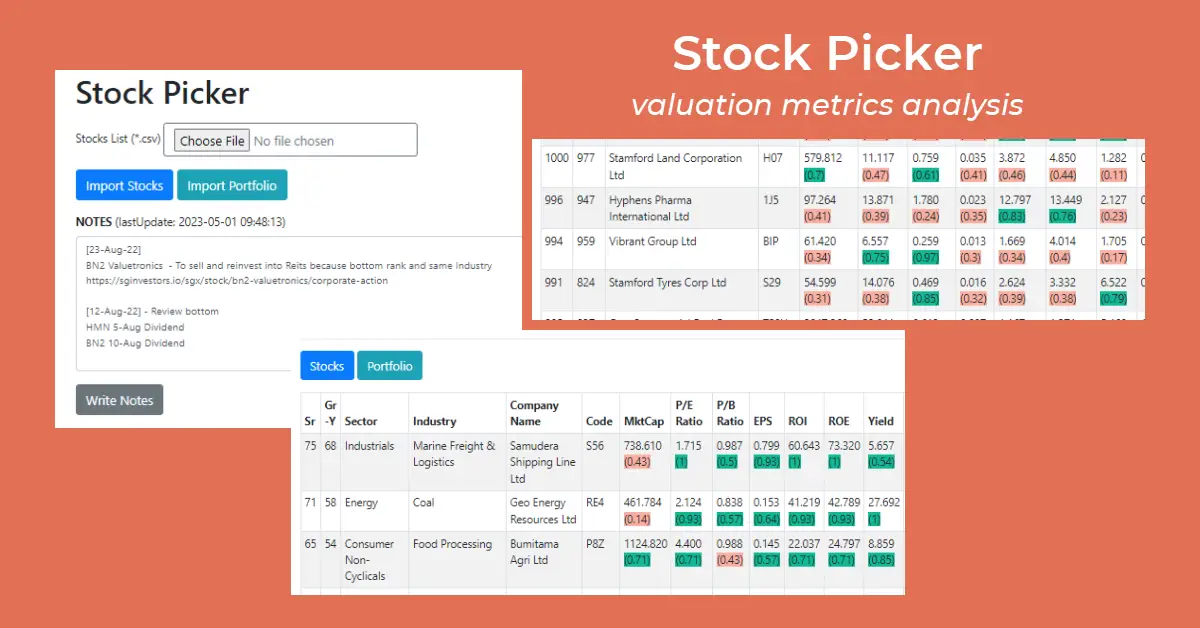
<textarea>and the last time they were updated. The notes may include information about the stocks you intend to purchase or sell, or the date at which dividends will be deposited into your account. - Stocks or Portfolio Switch Buttons: We introduce two buttons: [Stocks] and [Portfolio] that let us switch the table display to all available stocks in the market or stocks you already own.
Stocks Display Table
Stocks Header Explained
- Sr – Overall performance is calculated by the sum of metrics percentile
- Gr-Y – Growth stock where the “Yield” metric is left out of the equation
- Company Name, Code – Stock details
- MktCap, P/E Ratio, P/B Ratio, EPS, ROI, ROE, Yield – Valuation metrics measured in percentile
- AvgVol, Rating, Close, Last, LastUpdate – These are not measured and ignored
Portfolio Additional Headers
Be careful not to put all of your eggs in one basket. As we diversify our portfolio, we may want to analyze how much we put in each sector. If we concentrated our investments in a few sectors, we could further diversify our investments by focusing on the industry within which they operate.
- Sector – E.g., Technology, Healthcare, and Real Estate etc.
- Industry – E.g., Technology: Semiconductors, Electronic Equipment & Parts
Metrics as Percentile Explained
The website, Investopedia, explained that the price-to-earnings ratio (P/E ratio) compares a company’s current price to its per-share earnings. The P/E ratio is the price per share divided by the earnings per share. Therefore, we will seek the lowest price divided by the highest earnings per share, which implies that the lower the valuation of this metric, the better.
| Stock | P/E (low is better) | Order (high → low) | Percentile |
| Arrow Electronics | 2.124 | (worst) 13.061, 6.730, 4.400, 2.124 (best) | 4/4 = (1) |
| KeyCorp | 13.061 | 13.061, 6.730, 4.400, 2.124 | 1/4 = (0.25) |
| Tyson Foods | 6.730 | 13.061, 6.730, 4.400, 2.124 | 2/4 = (0.5) |
| Valero Energy | 4.400 | 13.061, 6.730, 4.400, 2.124 | 3/4 = (0.75) |
The aim of using percentiles with color coding is to make it easy to tell if a particular metric is healthy. For me, I’m not concerned with which one of the performance metrics is better, I’ll buy a stock with as many green indicators as possible. Even with red indicators, I will look at the percentile and make sure it isn’t too bad, for example, in the above table, I will accept (0.5) but not (0.25)
Sr and Gr-Y Explained
We could calculate the total sum of the metrics percentile as Sr, but since there are two hundred stocks, the variation between one another will be too small to get a good sense. For ‘higher the better‘ metrics, we use an array lowest (1) to the highest value (200), and the stock metric is ranked on a scale of 1 to 200. For ‘lower the better‘ metrics, we use an array lowest (200) to the highest value (1) to rank the metric. Thereafter, we add up all the metric ranks, and the higher the Sr, the better. Gr-Y is calculated similarly to Sr, but without the yield metric, as we are looking for growth stocks.
Example (higher the better): Array=[7.871, 8.496, 14.526, 29.268], Yield=29.268 will rank 4th (4 points)
Example (lower the better): Array=[6.313, 3.462, 2.326, 1.467], P/E=2.326 will rank 3rd (3 points)
<?php
require_once 'config.php';

$con = mysqli_connect($host, $user, $pass, $db);

$sql_notes = "SELECT option_value, lastupdate FROM options WHERE option_name = 'notes'";
$result_notes = mysqli_query($con, $sql_notes);
$row_notes = mysqli_fetch_assoc($result_notes);
?>

<!DOCTYPE html>
<html>
<head>
<title>Stock Picker</title>
<link rel="stylesheet" href="https://cdn.jsdelivr.net/npm/bootstrap@4.1.3/dist/css/bootstrap.min.css" integrity="sha384-MCw98/SFnGE8fJT3GXwEOngsV7Zt27NXFoaoApmYm81iuXoPkFOJwJ8ERdknLPMO" crossorigin="anonymous">
<style>
    body {
        font-size: 0.9em;
    }
    .greenTxt {
        background-color: #00b894;
    }
    .redTxt {
        background-color: #fab1a0;
    }
</style>
</head>
<body>

<div class="container">

<h1 class="mt-3">Stock Picker</h1>

<form action="action.php" method="post" enctype="multipart/form-data" class="mt-3">
    <div class="form-group">
        <label for="fileToUpload">Stocks List (*.csv)</label>
        <input class="btn btn-outline-secondary" id="fileToUpload" type="file" name="fileToUpload" id="fileToUpload">
    </div>
    <div class="mt-3 mb-3">
        <input class="btn btn-primary" type="submit" name="import_stocks" value="Import Stocks">
        <input class="btn btn-info" type="submit" name="import_portfolio" value="Import Portfolio">
    </div>
    <div class="form-group">
        <label for="notes"><strong>NOTES</strong> (lastUpdate: <?php echo $row_notes['lastupdate']; ?>)</label>
        <textarea class="form-control" id="notes" rows="8" name="notes" style="font-size:0.9em;"><?php echo $row_notes['option_value']; ?></textarea>
  </div>
  <div class="mt-3">
        <input class="btn btn-secondary" type="submit" name="write_notes" value="Write Notes">
    </div>
</form>

<hr class="mt-3 mb3-">

<div>
    <a class="btn btn-primary" href="?t=stocks" role="button">Stocks</a>
    <a class="btn btn-info" href="?t=portfolio" role="button">Portfolio</a>
</div>

<?php
/**
 * Store all stocks in an array
 */
if (isset($_GET['t']) && $_GET['t'] == 'portfolio') {
    $table = 'portfolio';
} else {
    $table = 'stocks';
}

$sql = "SELECT * FROM $table";
$result = mysqli_query($con, $sql);

while ($row = mysqli_fetch_assoc($result)) {
    if ($table == 'portfolio') {
        $stocks[$row['code']]['sector'] = $row['sector'];
        $stocks[$row['code']]['industry'] = $row['industry'];
    }
    $stocks[$row['code']]['companyname'] = $row['companyname'];
    $stocks[$row['code']]['mktcap'] = $row['mktcap'];
    $stocks[$row['code']]['pe'] = $row['pe'];
    $stocks[$row['code']]['pb'] = $row['pb'];
    $stocks[$row['code']]['eps'] = $row['eps'];
    $stocks[$row['code']]['roi'] = $row['roi'];
    $stocks[$row['code']]['roe'] = $row['roe'];
    $stocks[$row['code']]['yield'] = $row['yield'];
    $stocks[$row['code']]['avgvol'] = $row['avgvol'];
    $stocks[$row['code']]['rating'] = $row['rating'];
    $stocks[$row['code']]['close'] = $row['close'];
    $stocks[$row['code']]['last'] = $row['last'];
    $stocks[$row['code']]['lastupdate'] = $row['lastupdate'];
}

/**
 * Strip label into each array for scoring
 */
$mktcap = $pe = $pb = $eps = $roi = $roe = $yield = array(); // for array_search()
foreach ($stocks as $code => $details) {
    if (!empty($details['mktcap']) && !array_search($details['mktcap'], $mktcap)) { $mktcap[] = $details['mktcap']; }
    if (!empty($details['pe']) && !array_search($details['pe'], $pe)) { $pe[] = $details['pe']; }
    if (!empty($details['pb']) && !array_search($details['pb'], $pb)) { $pb[] = $details['pb']; }
    if (!empty($details['eps']) && !array_search($details['eps'], $eps)) { $eps[] = $details['eps']; }
    if (!empty($details['roi']) && !array_search($details['roi'], $roi)) { $roi[] = $details['roi']; }
    if (!empty($details['roe']) && !array_search($details['roe'], $roe)) { $roe[] = $details['roe']; }
    if (!empty($details['yield']) && !array_search($details['yield'], $yield)) { $yield[] = $details['yield']; }
}

/**
 * Sort each label by key=score points
 */
asort($mktcap); // higher better
// start [1] instead [0] so lowest mktcap get 1 pt instead 0
$mktcap_new = array_combine(range(1, count($mktcap)), array_values($mktcap));

arsort($pe); // lower better
$pe_new = array_combine(range(1, count($pe)), array_values($pe));

arsort($pb); // lower better
$pb_new = array_combine(range(1, count($pb)), array_values($pb));

asort($eps); // higher better
$eps_new = array_combine(range(1, count($eps)), array_values($eps));

asort($roi); // higher better
$roi_new = array_combine(range(1, count($roi)), array_values($roi));

asort($roe); // higher better
$roe_new = array_combine(range(1, count($roe)), array_values($roe));

asort($yield); // higher better
// start [1] instead [0] so lowest yield get 1 pt instead 0
$yield_new = array_combine(range(1, count($yield)), array_values($yield));

/**
 * Each stock now has each label score (from key) and percentile (sort of like rating)
 */
foreach ($stocks as $code => $details) {
    $score[$code]['mktcap'] = array_search($details['mktcap'], $mktcap_new, true);
    $score[$code]['mktcap_percentile'] = round($score[$code]['mktcap'] / array_key_last($mktcap_new), 2); // percentile

    $score[$code]['pe'] = array_search($details['pe'], $pe_new, true);
    $score[$code]['pe_percentile'] = round($score[$code]['pe'] / array_key_last($pe_new), 2); // percentile

    $score[$code]['pb'] = array_search($details['pb'], $pb_new, true);
    $score[$code]['pb_percentile'] = round($score[$code]['pb'] / array_key_last($pb_new), 2); // percentile

    $score[$code]['eps'] = array_search($details['eps'], $eps_new, true);
    $score[$code]['eps_percentile'] = round($score[$code]['eps'] / array_key_last($eps_new), 2); // percentile

    $score[$code]['roi'] = array_search($details['roi'], $roi_new, true);
    $score[$code]['roi_percentile'] = round($score[$code]['roi'] / array_key_last($roi_new), 2); // percentile

    $score[$code]['roe'] = array_search($details['roe'], $roe_new, true);
    $score[$code]['roe_percentile'] = round($score[$code]['roe'] / array_key_last($roe_new), 2); // percentile

    $score[$code]['yield'] = array_search($details['yield'], $yield_new, true);
    $score[$code]['yield_percentile'] = round($score[$code]['yield'] / array_key_last($yield_new), 2); // percentile
}

/**
 * (SUM ALL): Sum each stock scores in an array e.g. pe + pb + eps ... for stock screener
 */
foreach ($score as $code => $details) {
    $score_total[$code] = $details['mktcap'] + $details['pe'] + $details['pb'] + $details['eps'] + $details['roi'] + $details['roe'] + $details['yield'];
}

/**
 * (SUM ALL exclude Yield) for GROWTH stocks
 */
foreach ($score as $code => $details) {
    $score_total_G[$code] = $details['mktcap'] + $details['pe'] + $details['pb'] + $details['eps'] + $details['roi'] + $details['roe'];
}

/**
 * Table output by highest total score
 */
arsort($score_total);
echo '<table class="table table-sm table-striped table-bordered mt-3">';
echo '<thead>';
echo '<tr>';
echo '<th scope="col">Sr</th>';
echo '<th scope="col">Gr<br>-Y</th>';
if ($table == 'portfolio') {
    echo '<th scope="col">Sector</th>';
    echo '<th scope="col">Industry</th>';
}
echo '<th scope="col">Company Name</th>';
echo '<th scope="col">Code</th>';
echo '<th scope="col">MktCap</th>';
echo '<th scope="col">P/E Ratio</th>';
echo '<th scope="col">P/B Ratio</th>';
echo '<th scope="col">EPS</th>';
echo '<th scope="col">ROI</th>';
echo '<th scope="col">ROE</th>';
echo '<th scope="col">Yield</th>';
echo '<th scope="col">AvgVol</th>';
echo '<th scope="col">Rating</th>';
echo '<th scope="col">Close</th>';
echo '<th scope="col">Last</th>';
echo '<th scope="col">LastUpdate</th>';
echo '</tr>';
echo '</thead>';
echo '<tbody>';
foreach ($score_total as $code => $total_score) {
    echo '<tr>';
    echo '<td>'.$total_score.'</td>';
    echo '<td>'.$score_total_G[$code].'</td>';
    if ($table == 'portfolio') {
        echo '<td>'.$stocks[$code]['sector'].'</td>';
        echo '<td>'.$stocks[$code]['industry'].'</td>';
    }
    echo '<td>'.$stocks[$code]['companyname'].'</td>';
    echo '<td>'.$code.'</td>';
    echo '<td>'.$stocks[$code]['mktcap'].redGreen($score[$code]['mktcap_percentile']).'</td>';
    echo '<td>'.$stocks[$code]['pe'].redGreen($score[$code]['pe_percentile']).'</td>';
    echo '<td>'.$stocks[$code]['pb'].redGreen($score[$code]['pb_percentile']).'</td>';
    echo '<td>'.$stocks[$code]['eps'].redGreen($score[$code]['eps_percentile']).'</td>';
    echo '<td>'.$stocks[$code]['roi'].redGreen($score[$code]['roi_percentile']).'</td>';
    echo '<td>'.$stocks[$code]['roe'].redGreen($score[$code]['roe_percentile']).'</td>';
    echo '<td>'.$stocks[$code]['yield'].redGreen($score[$code]['yield_percentile']).'</td>';
    echo '<td>'.$stocks[$code]['avgvol'].'</td>';
    echo '<td>'.$stocks[$code]['rating'].'</td>';
    echo '<td>'.$stocks[$code]['close'].'</td>';
    echo '<td>'.$stocks[$code]['last'].'</td>';
    echo '<td>'.$stocks[$code]['lastupdate'].'</td>';
    echo '</tr>';
}
echo '</tbody>';
echo '</table>';

// closing connection
mysqli_close($con);
?>

</div>

</body>
</html>

<?php
function redGreen($percentile) {
    if ($percentile >= 0.5) {
        $s = '<br><span class="greenTxt">('.$percentile.')</span>';
    } else {
        $s = '<br><span class="redTxt">('.$percentile.')</span>';
    }

    return $s;
}
Step 3 – Form Actions
- Upload CSV and Insert Data: We set the target table to insert based on the name of the submit button on the upload form. After we truncate (empty) the table, we use
fgetcsvto loop andINSERTthe latest data. To avoid inserting the CSV header into the SQL table, we perform astrcmpfor the ‘Company Name’ column field, which is common for both “available stocks” and portfolio uploads.
2. Update Notes: This is a simple UPDATE statement to replace the old notes with new ones.
<?php
require_once 'config.php';

$con = mysqli_connect($host, $user, $pass, $db);

// Check connection
if (mysqli_connect_errno()) {
    echo "Failed to connect to MySQL: " . mysqli_connect_error();
    exit();
}

/**
 * Read stocks CSV import
 */
$filename = 'uploads/stocks.csv';

/**
 * Deal with single printers list CSV
 */
if (isset($_POST["import_stocks"]) || isset($_POST["import_portfolio"])) {

    if (isset($_POST["import_stocks"])) {
        $table = 'stocks';
    } else {
        $table = 'portfolio';
    }

    $file_tmp = $_FILES['fileToUpload']['tmp_name'];

    if (move_uploaded_file($file_tmp, $filename)) {
        // Clear all rows
        $sql = "TRUNCATE TABLE $table";
        mysqli_query($con, $sql);

        if (($handle = fopen($filename, "r")) !== false) {
            while (($data = fgetcsv($handle, 1000, ",")) !== false) {
                $num = count($data);

                for ($c=0; $c < $num; $c++) {
                    if ($data[$c] == '--') {
                        $data[$c] = 'NULL'; // or else INSERT fail DECIMAL
                    }
                    $data[$c] = str_replace(",", "", $data[$c]); // mktcap 12,098.68 INSERT fail
                }

                if (strcmp($data[0], 'Company Name') !== 0) { // skip header
                    // Portfolio got Sector and Industry
                    if (isset($_POST["import_portfolio"])) {
                        $sql = "INSERT INTO $table VALUES ('$data[0]', '$data[1]', '$data[2]', '$data[3]', $data[4],
                                $data[5], $data[6], $data[7], $data[8], $data[9], $data[10], $data[11], $data[12],
                                $data[13], $data[14], NOW())";
                    } else {
                        $sql = "INSERT INTO $table VALUES ('$data[0]', '$data[1]', $data[2], $data[3], $data[4],
                                $data[5], $data[6], $data[7], $data[8], $data[9], $data[10], $data[11], $data[12],
                                NOW())";
                    }

                    if (mysqli_query($con, $sql)) {
                        //echo "Records added successfully.";
                    } else {
                        echo "ERROR: Could not able to execute $sql. " . mysqli_error($con);
                    }
                }

            }
            fclose($handle);
        }
    } else {
        echo '<div class="alert alert-danger" role="alert">';
        echo 'Error uploading';
        echo '</div>';
    }
}

/**
 * Update notes
 */
if (isset($_POST["write_notes"])) {
    $sql = 'UPDATE options SET option_value = "'. $_POST['notes'] .'", lastupdate = NOW()
            WHERE option_name = "notes"';

    if (mysqli_query($con, $sql)) {
        //echo "Notes updated successfully.";
    } else {
        echo "ERROR: Could not able to execute $sql. " . mysqli_error($con);
    }
}

// Closing connection
mysqli_close($con);

// Back to form after all actions completed
header('Location: /');
exit;
Optional Read
Pick one stock to buy
If I want to invest long-term, I’ll look for a stock with a high Yield %. If not, I might as well put the money in a local bank and earn interest, right? The stock table is already sorted by “Sr” from high to low as a default. I will look at the share price of the top five stocks and focus on the ones with all or most green metrics (percentile)
Reduce portfolio by selling one stock
Under the portfolio table, you can see a list of stocks you own. I will choose the bottom three stocks and try to sell the one with the most red numbers. This is because they are the worst lot, and the ones that don’t even have at least one or two metrics that are above the minimum percentile should be the first to be let go.
Conclusion
I do equity investments, but I don’t keep an eye on them 24/7. Every few months, I review and sell off the bottom performing one and reinvest in one of the top positioned stocks. The Stock Picker is not a perfect system because some stocks in my portfolio went down a lot in a few days after I bought them. However, with this stock screener, I can shortlist healthy stocks that are well-balanced in most metrics measurements and easily sell off the bad ones. No doubt, I still have to wait for the right entry point, but I will already have two to three stocks in mind and will buy anyone because I am looking for a long-term investment.