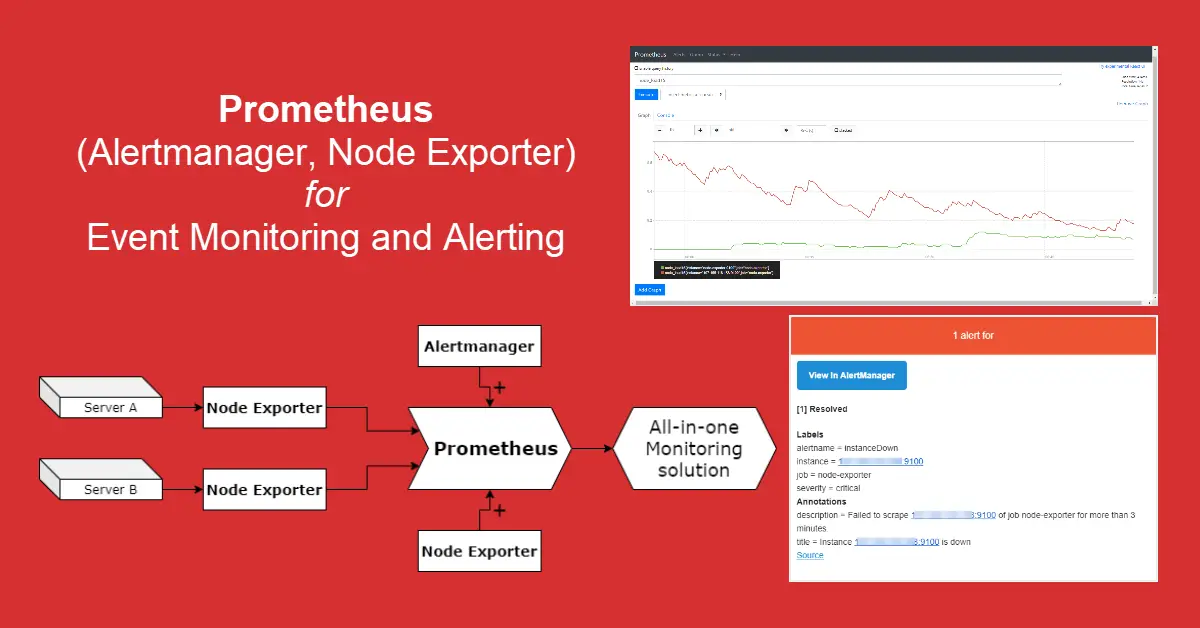
Introduction
Previously, we discovered how to deploy Terraform as infrastructure provisioning tool. Today we will learn about infrastructure monitoring. While old-time favorites Zabbix and Nagios are still under active development, Prometheus integrated with Grafana has become a common monitoring stack for DevOps teams. Prometheus 1.0 was released in July 2016. The server scrapes real-time metrics from specific targets at intervals and store them in a time-series database while its configurations are stored in the prometheus.yml configuration file. We will also integrate both Alertmanager and Node Exporter with Prometheus so that we obtain a all-in-one monitoring solution.
Background
Zabbix was the first monitoring software that I encountered when I worked as a network engineer in 2007. I was so engrossed with this software that I spent days and weeks trying to tweak each conditions and triggers over the next three years. Currently, I’m using StatusCake and HetrixTools to monitor all my websites and to ping my VPS. Both services let you sign up for free but with certain limitations, e.g., HetrixTools allows maximum 15 monitors. Of all the DevOps tools that were posted at TechSch, Prometheus is one of the tools that will remain actively in-use because to monitor server health is important and the uptime reports etc. make me feel that I am in control of my asset (servers).
Prerequisites
- A Linux server with Docker and Docker Compose installed to act as Prometheus server.
- (optional) Second server for Prometheus server to perform remote monitoring (scraping).
- YAML language for various configuration files.
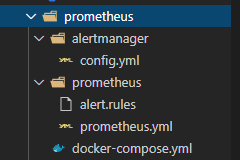
- Prepare the project directory structure as below
Step 1 – Set Up Prometheus Server
Open a new docker-compose.yml file and add the first service – Prometheus. The time series data collected is stored in the ./prometheus directory. We can refer to Prometheus docs on storage to see the on-disk layout of the server’s data directory. The lines –config.file is pretty standard across all web tutorials and –storage.tsdb.retention.time is optional as this determines when to remove old data. If not used, the default is 15 days. The line ports: – “9090:9090” is only required If you wish to curl or wget http://localhost:9090/metrics but even without this, Prometheus server will still be able to self-scrape metrics (e.g. prometheus_build_info and prometheus_http_requests_total) because the container is expose: with – VIRTUAL_PORT=9090 for nginx-proxy.
  prometheus:
    image: prom/prometheus:latest
    container_name: prometheus
    volumes:
      - ./prometheus:/etc/prometheus
    command:
      - '--config.file=/etc/prometheus/prometheus.yml'
      - '--storage.tsdb.retention.time=30d'
    restart: unless-stopped
    #ports:
      #- "9090:9090"
    environment:
      - VIRTUAL_HOST=prometheus.example.com
      - VIRTUAL_PORT=9090
      - LETSENCRYPT_HOST=prometheus.example.com
      - LETSENCRYPT_EMAIL=hello@gmail.com
Next, we place our Prometheus configurations in the prometheus.yml file. (from top to bottom) First, we include some global monitoring configurations and setup the Alertmanager. Second, we define our trigger conditions in the alert.rules file. Third, we configure Prometheus server to scrape itself and a remote server with IP 174.23.44.145.
global:
scrape_interval: 30s # By default, scrape targets every 1 minute.
evaluation_interval: 30s # By default, evaluate rules every 1 minute.
#scrape_timeout: 10s # By default, a scrape request times out in 10 seconds.
# Alertmanager configuration
alerting:
alertmanagers:
- static_configs:
- targets:
- alertmanager:9093
# Load rules once and periodically evaluate them according to the global 'evaluation_interval'.
rule_files:
- "alert.rules"
# Configuring Prometheus to monitor itself - https://prometheus.io/docs/prometheus/latest/getting_started/
scrape_configs:
- job_name: 'prometheus'
# Override the global values and scrape targets for this job every 10 seconds.
scrape_interval: 10s
static_configs:
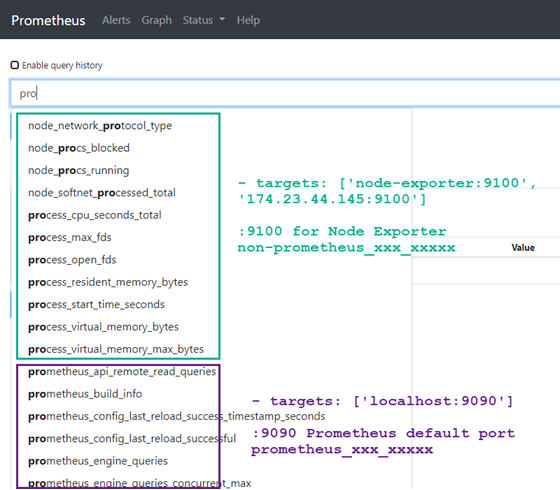
# Execute query expressions prometheus_abc_xyz
- targets: ['localhost:9090']
- job_name: 'node-exporter'
scrape_interval: 10s
static_configs:
# node-exporter:9100 where node-exporter is service name in docker-compose.yml
# Execute non-prometheus_abc_xyz query expressions, e.g., node_load1 etc.
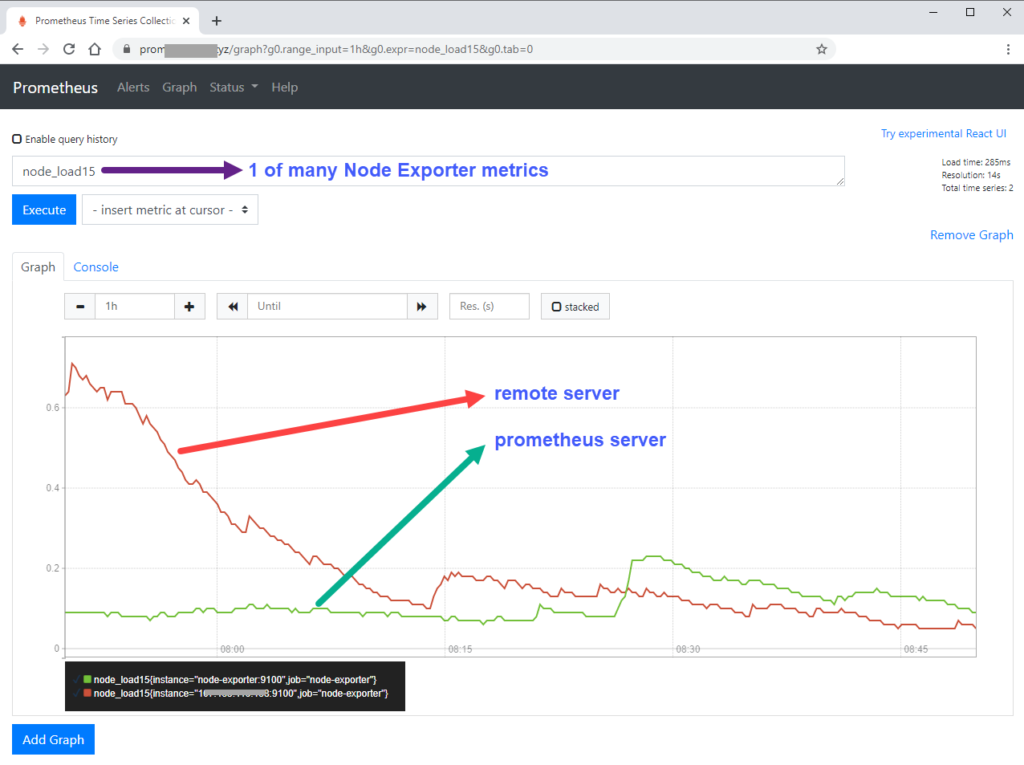
- targets: ['node-exporter:9100', '174.23.44.145:9100']IMPORTANT: targets: ‘localhost:9090’ tells Prometheus server to collect metrics related to prometheus monitoring operation with related query expressions starting with prometheus_ (e.g. prometheus_build_info and prometheus_engine_queries etc.) whereas ‘node-exporter:9100’ scrape the Prometheus server for various hardware monitoring metrics of Linux, including temperature, fans, and voltages. See the differences below.
Step 2 – Add Alertmanager to Send Alerts via Slack, PagerDuty and Email
To set up Prometheus server with Docker Compose is simple but a monitoring server is only informative to a system administrator without the alerting feature. While monitoring, triggering conditions and alerting come as a packaged solution for other monitoring tools, Prometheus had these as an optional package/service. In order to use Alertmanager, we add it as a Docker service. The data for Alertmanager is stored in the alertmanager directory. Again, ports: – “9093:9093” is only required If you wish to curl or access http://localhost:9093/ but in this case, we are able to access Alertmanager in a browser via URL alertmanager.example.com because of nginx-proxy.
  alertmanager:
    image: prom/alertmanager:latest
    container_name: alertmanager
    volumes:
      - ./alertmanager:/etc/alertmanager
    command:
      - '--config.file=/etc/alertmanager/config.yml'
      - '--storage.path=/alertmanager'
    restart: unless-stopped
    #ports:
      #- "9093:9093"
    environment:
      - VIRTUAL_HOST=alertmanager.example.com
      - VIRTUAL_PORT=9093
      - LETSENCRYPT_HOST=alertmanager.example.com
      - LETSENCRYPT_EMAIL=hello@gmail.com
Below is the config.yml for alertmanager which defines what methods to use to send out alerts to the server administrator. The popular platforms are via Slack, PagerDuty and Email. We can deliver alerts to a single receiver route which can then be sent off using multiple services. For example, route to receiver: ‘slack_gmail’ to send notifications via Slack and Email.
route:
  receiver: 'slack_gmail'

receivers:
  - name: 'slack_mxroute'
    slack_configs:
      - send_resolved: true
        text: "{{ .CommonAnnotations.description }}"
        username: 'Prometheus'
        channel: '#<channel-name>'
        api_url: 'https://hooks.slack.com/services/<webhook-id>'

    email_configs:
      - to: hello@gmail.com
        from: prometheus_alerts@gmail.com
        smarthost: smtp.gmail.com:587
        auth_username: prometheus_alerts@gmail.com
        auth_password: secret
        send_resolved: true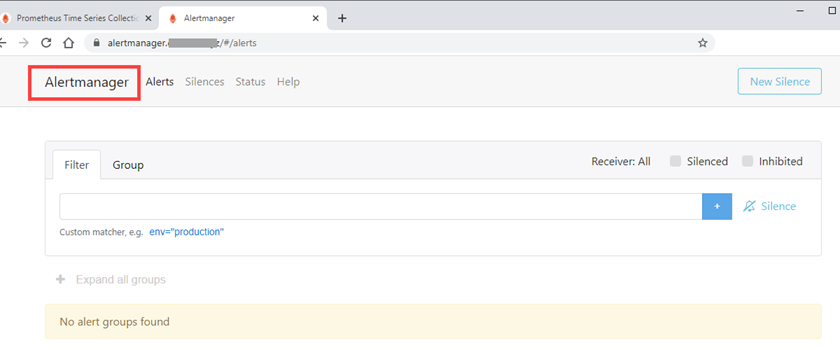
Step 3 – Install Node Exporter to Expose Monitoring Metrics for Scraping
Node Exporter, like Alertmanager is optional because Prometheus will run fine without it. Node Exporter exposes hardware and kernel related metrics on local and remote hosts. If installed on remote Server A, Prometheus server (using prometheus.yml) can be configured to scrape metrics via URL, e.g., http://<serverA-ip>:9100/metrics. To run Node Exporter on Prometheus server itself, we add the final third Docker Compose service. We will not go into details to explain what each lines under volumes: and command: are for but rather they are copied from Using Docker section at prometheus/node_exporter. This time round, we uncomment the optional ports: – 9100:9100 for sanity check due to no access via URL – curl localhost:9100/metrics.
  node-exporter:
    image: prom/node-exporter:latest
    container_name: node-exporter
    volumes:
      - /proc:/host/proc:ro
      - /sys:/host/sys:ro
      - /:/rootfs:ro
    command:
      - '--path.procfs=/host/proc'
      - '--path.sysfs=/host/sys'
      - '--path.rootfs=/rootfs'
      - '--collector.filesystem.ignored-mount-points=^/(sys|proc|dev|host|etc)($$|/)'
    ports:
      - 9100:9100
    restart: unless-stopped
Step 4 – Install Node Exporter on Remote Servers (optional)
To install node exporter on a remote ‘to-be-monitored’ host, SSH into that server and download the tar file. Replace 1.0.1 with the latest version from prometheus/node_exporter @GitHub
$ wget https://github.com/prometheus/node_exporter/releases/download/v1.0.1/node_exporter-1.0.1.linux-amd64.tar.gz
$ tar xvfz node_exporter-*.*-amd64.tar.gz

$ sudo mv node_exporter-*/node_exporter /usr/local/bin/
$ sudo useradd -rs /bin/false node_exporter
$ sudo chown node_exporter:node_exporter /usr/local/bin/node_exporter
To run the Node Exporter as a service, we need to create a custom systemd service for it.
$ sudo vi /etc/systemd/system/node_exporter.service

[Unit]
Description=Node Exporter
After=network.target

[Service]
User=node_exporter
Group=node_exporter
Type=simple
ExecStart=/usr/local/bin/node_exporter

[Install]
WantedBy=multi-user.target
$ sudo systemctl enable node_exporter
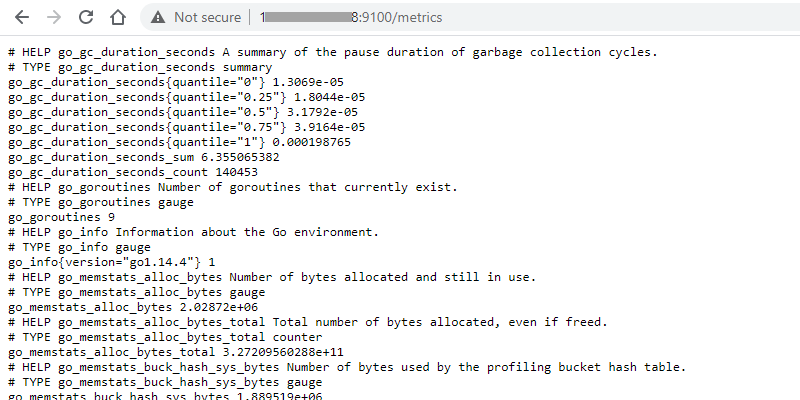
$ sudo systemctl start node_exporterTo verify that the installation was successful, open the browser and access the page http://<server-ip>:9100/metrics and we should get something like this.
Step 5 – All Services Consolidated in docker-compose.yml
We will now consolidate all three services (Prometheus, Alertmanager and Node Exporter) into docker-compose.yml file. We will also prepare two configuration files, prometheus.yml and config.yml for Prometheus and Alertmanager respectively. Last but not least, we will include the alert.rules file to create a condition that we want to monitor for DOWN status in order to test sending of alerts. Here is a quick recap of the mentioned files:
- docker-compose.yml – Launch Prometheus server to scrape real-time metrics, Alertmanager to handle alerts sent by client applications and Node Exporter to expose hardware and kernel related metrics on Prometheus server for self-monitoring.
- prometheus.yml – Configurations for Prometheus server.
- config.yml – Configurations for applications such as Slack, PagerDuty and Email for Alertmanager to route alerts.
- alert.rules – What metrics to monitor? How long is the duration before it is considered DOWN? What message to send out?
version: '3'
services:
  prometheus:
    image: prom/prometheus:latest
    container_name: prometheus
    volumes:
      - ./prometheus:/etc/prometheus
    command:
      - '--config.file=/etc/prometheus/prometheus.yml'
      - '--storage.tsdb.retention.time=30d'
    restart: unless-stopped
    #ports:
      #- "9090:9090"
    environment:
      - VIRTUAL_HOST=prometheus.example.com
      - VIRTUAL_PORT=9090
      - LETSENCRYPT_HOST=prometheus.example.com
      - LETSENCRYPT_EMAIL=hello@gmail.com

  alertmanager:
    image: prom/alertmanager:latest
    container_name: alertmanager
    volumes:
      - ./alertmanager:/etc/alertmanager
    command:
      - '--config.file=/etc/alertmanager/config.yml'
      - '--storage.path=/alertmanager'
    restart: unless-stopped
    #ports:
      #- "9093:9093"
    environment:
      - VIRTUAL_HOST=alertmanager.example.com
      - VIRTUAL_PORT=9093
      - LETSENCRYPT_HOST=alertmanager.example.com
      - LETSENCRYPT_EMAIL=hello@gmail.com

  node-exporter:
    image: prom/node-exporter:latest
    container_name: node-exporter
    volumes:
      - /proc:/host/proc:ro
      - /sys:/host/sys:ro
      - /:/rootfs:ro
    command:
      - '--path.procfs=/host/proc'
      - '--path.sysfs=/host/sys'
      - '--path.rootfs=/rootfs'
      - '--collector.filesystem.ignored-mount-points=^/(sys|proc|dev|host|etc)($$|/)'
    ports:
      - 9100:9100
    restart: unless-stopped

networks:
  default:
    external:
      name: nginx-proxy
Finally, we start up our applications by running docker-compose up -d. We should be able to access Prometheus server from the browser now.
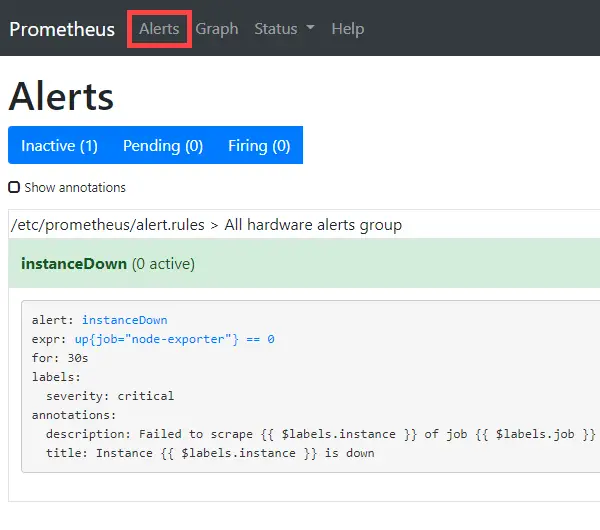
We can also test the alert rules. On the left image, expr: up{job=”node-exporter”} == 0 – There is this line – job_name: ‘node-exporter’ in prometheus.yml and if this job of scraping targets fails for at least 30 seconds (for: 30s), an alert will be sent via Gmail SMTP (email sample on the right).

Conclusion
In my opinion, I would think that there is a steeper learning curve to Prometheus than open-source monitoring software such as Zabbix and Nagios. This is because everything has to be configured via YAML files and it seems that there isn’t any GUI to assist in creating conditions to monitor metrics either. However, in the next tutorial, we will learn Grafana – cool looking dashboard interfaces for analysis and visualization of data collected by Prometheus. Moving forward, I plan to use Prometheus to monitor all my server’s CPU load, free memory and disk spaces so that I will know when to upgrade to a bigger Virtual Private Server (VPS). After trying out Prometheus for a few weeks, I had only one word to describe it – slick!