Introduction
Red Hat OpenShift built on top of Kubernetes is used in many organisations these days. The OpenShift container platform allows for container orchestration and management through a web console with ease. It is a trusted Platform as a Service (PaaS) and designed to handle large-scale deployment through scalability. This tutorial will install Grafana and VictoriaMetrics operator to create a monitoring system. It has a marketplace known as OperatorHub, where one can quickly deploy popular apps.
Background
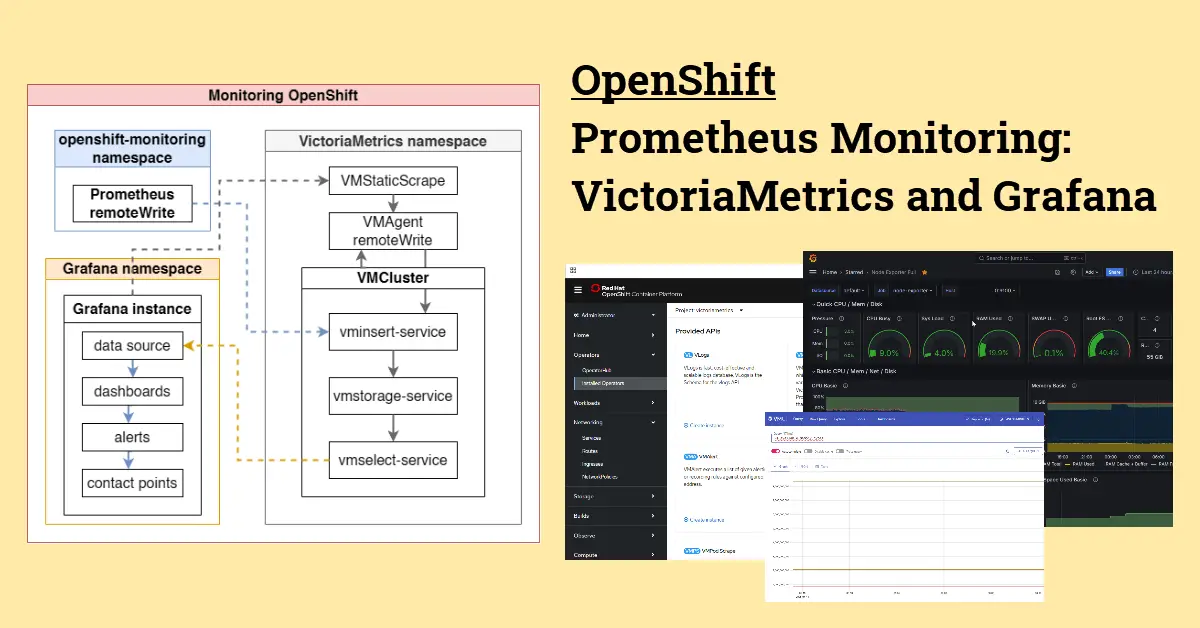
Prometheus is the OpenShift default monitoring stack used to scrape cluster and application health metrics. Some cluster metrics include number of total CPUs and memory available, while application health metrics are exposed by respective node exporters, such as PostgreSQL and Redis exporter. The openshift-monitoring namespace contains other components of Prometheus, such as Alertmanager. By default, this Prometheus is configured to retain metrics for only 15 days. If it is important for your organisation to keep more than a few months worth of metrics, then a time-series database such as VictoriaMetrics will be preferred. Grafana is a great metrics visualization tool to stand in for OpenShift’s built-in observation metrics tool.
Step 1 – Install VictoriaMetrics and Grafana Operator
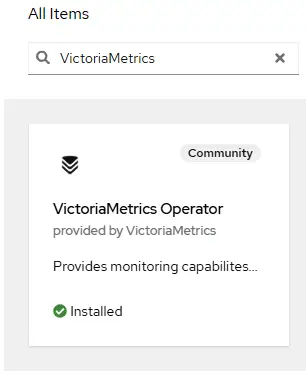
Find ‘VictoriaMetrics‘ and ‘Grafana‘ in OperatorHub to install the operators. Go to Installed Operators and click on VictoriaMetrics Operator after installing. There are several components, such as VLogs, VMAgent, and VMAlertmanager, but in this tutorial, we will only use VMCluster – a scalable time-series database to store metrics data from OpenShift Prometheus monitoring. Optional components used in this tutorial also include VMAgent and VMStaticScrape.
VMSingle vs VMCluster Types
Both single and cluster types are production-ready and can handle big workloads with an ingestion rate of millions of samples per second, according to VictoriaMetrics Docs here. My recommendation is to go with VMCluster if you are using OpenShift because it is easy to scale cluster. If you want to deploy over limited cloud resources, like Amazon EC2 instance, you can use VMSingle. VMCluster does have additional features that it supports:
- Multi-tenancy – For example, Team A deploys apps in namespace-A and Team B deploys apps in namespace-B, and thus both teams can import and export their isolated metrics to the VMCluster database. Also works for cluster-A and cluster-B isolation using:
/select/{accountId:projectId}/ - Horizontal scaling – VMCluster has higher scaleability when scaling horizontally when compared to VMSingle if one needs to ingest increased samples exceeding a million samples per second later on.
- vmui UI – VictoriaMetrics cluster version provides the UI (here) for initial setup and query exploration. This is useful to figure out why certain metrics aren’t written to the database.
Step 2 – Create VMCluster
When creating a VMCluster instance, one is presented with a form with many options and inputs, but the default settings should spin up a working VMCluster without issues. However, the default settings are for low ingestion deployment because there are only a few replicas deployed. Through trial and error, it has been found that scaling both horizontal and vertical is required for mid-size deployments, or else the default setup resources limit will cause vmstorage to become unreachable. In a nutshell, an example of horizontal scaling by increasing the number of pods for all 3 components of VMCluster:
- vminsert: number of pods = 2 (default) → 4
- vmselect: number of pods = 2 (default) → 4
- vmstorage: number of pods = 2 (default) → 6
Scaling and Config for Mid-Size Deployment
| Node/ CpuMem | vminsert | vmselect | vmstorage | Remark | Error |
| (default) Num nodes ReqCPU__LimitCPU ReqMem__LimitMem Storage | 2 0.5__1 500Mi_1000Mi nil | 2 0.5__1 500Mi__1000Mi 2Gi | 2 Nil__1 Nil__1500Mi 10Gi | RetentionPeriod: 4 → 6 ReplicationFactor: 2 → 1 storageClassName: my-storage-tierX | Err logs: Yes Grafana display: No |
| (scale horizontal) Num nodes ReqCPU__LimitCPU ReqMem__LimitMem Storage | 3 0.5__1 500Mi__1000Mi nil | 3 0.5__1 500Mi__1000Mi 2Gi | 3 Nil__1 Nil__1500Mi 10Gi | RetentionPeriod: 4 → 6 ReplicationFactor: 2 → 1 storageClassName: my-storage-tierX | Err logs: Yes Grafana display: No |
| (scale horizontal / vertically) Num nodes ReqCPU__LimitCPU ReqMem__LimitMem Storage | 4 1__2 1000Mi__2000Mi nil | 4 1__2 1000Mi__2000Mi 2Gi | 6 Nil__2 Nil__3000Mi 10Gi__500Gi* | RetentionPeriod: 4 → 6 ReplicationFactor: 2 → 1 storageClassName: my-storage-tierX | Err logs: No Grafana display:Yes |
The Need Horizontal and Vertical Scaling
Below are the captured error logs for both the vminsert and vmstorage components of VMCluster. The errors come from the fact that vminsert can’t contact vmstorage for writes because vmstorage hit its memory limit. With horizontal scaling at first, the VM cluster lasted a few minutes longer than the default setup before similar errors started to appear. When scaled both horizontally by increasing the number of vminsert and vmstorage pods and vertically by increasing the CPU and memory limit of each pod, such errors were eliminated.
| Strategy | Error log |
| (default) | # vminsert podwarn VictoriaMetrics/app/vminsert/main.go:255 remoteAddr: "172.1.1.1:38792"; requestURI: /insert/0/prometheus/api/v1/write; cannot read compressed request in 60 seconds: cannot process insert request for 60.000 seconds because 2 concurrent insert requests are executed. Possible solutions: to reduce workload; to increase compute resources at the server; to increase -insert.maxQueueDuration; to increase -maxConcurrentInserts |
| (scale horizontal) | # vminsert podrequestURI: /insert/0/prometheus/api/v1/write; cannot read compressed request in 60 seconds: cannot process insert request for 60.000 seconds because 2 concurrent insert requests are executed. Possible solutions: to reduce workload; to increase compute resources at the server; to increase -insert.maxQueueDuration; to increase -maxConcurrentInserts# vmstorage INFO pod info VictoriaMetrics/app/vmstorage/servers/vmselect.go:292 limiting -search.maxUniqueTimeseries to 1572864 according to -search.maxConcurrentRequests=2 and remaining memory=629145600 bytes. To increase the limit, reduce -search.maxConcurrentRequests or increase memory available to the process. |
| (scale horizontal / vertically) | # No vminsert error # vmstorage INFO pod info VictoriaMetrics/app/vmstorage/servers/vmselect.go:292 limiting -search.maxUniqueTimeseries to 1572864 according to -search.maxConcurrentRequests=4 and remaining memory=1258291200 bytes. To increase the limit, reduce -search.maxConcurrentRequests or increase memory available to the process. |
Other changes you may want to update depend on your objectives and requirements. The retention period affects how much of the allocated persistent volume is used, and OpenShift will alert warning at 75% and critical at 85%. The Storage class affects how fast the IO threshold which vmstorage can answer to vminsert write requests without timeout is, bearing in mind Prometheus could be writing thousands of metrics per second. The replication factor depends on your organisation, is it alright to lose metrics data in case of 1 or more vmstorage pods getting degraded?
- retentionPeriod = 4 (default) → 6 or 12 (e.g., longer for trend analysis)
- vmselect and vmstorage > + claimTemplates > spec > storageClassName = (indicate your-storageTier)
If you can’t find the storageClassName under Form view, you can switch to YAML and manually update the entry. - ReplicationFactor = 2 (default) → 1 (is metrics data availability critical?)
storage:
    volumeClaimTemplate:
      spec:
        accessModes:
          - ReadWriteOnce
        resources:
          requests:
            storage: 500Gi
        storageClassName: indicate your-storageTier
Below shows a typical log that replication failed due to vmstorage limitation: warn VictoriaMetrics/app/vminsert/netstorage/netstorage.go:232 cannot make a copy #2 out of 2 copies according to -replicationFactor=2 for 30870281 bytes with 55031 rows, since a part of storage nodes is temporarily unavailable
Solution (temporary fix): If data replication isn’t crucial, you can set the replication factor=1 to avoid warnings until all nodes are stable again.
Update Prometheus ConfigMap – cluster-monitoring-config
Before you apply changes, save a backup copy of Prometheus Custom Resource (CR), in this case the cluster-monitoring-config YAML.$ oc get prometheus k8s -n openshift-monitoring -o yaml
Go to OpenShift Project: (openshift-monitoring or openshift-user-workload-monitoring) > Workloads > ConfigMaps > cluster-monitoring-config > Actions drop-down > Edit ConfigMap > Add remoteWrite codes below (Prometheus setup)
prometheusK8s:
  remoteWrite:
  - queue_config:
      capacity: 20000
      max_samples_per_send: 10000
      max_shards: 30
    url: http://vminsert-vmcluster-example.grafana.svc.cluster.local:8480/insert/0/prometheus/api/v1/
To find vminsert URL, go Networking > Services > vminsert-vmcluster-example > Hostname and Service port mapping. This step sends the scraped data from Prometheus to the VictoriaMetrics vminsert component, which then stores it in vmstorage. Unless there is some level of customization needed for specific use cases, it is generally recommended to add the remoteWrite configuration to openshift-monitoring ConfigMap for ease of system-wide integration.
Step 3 – Create Grafana Instance
The Grafana operator makes it easy to create a Grafana instance. Though it is important to note that you will want to provision a persistentVolumeClaim so that any configurations done, dashboard imported, and alert rules created will be retained if the pod is accidentally deleted.
spec:
  persistentVolumeClaim:
    spec:
      accessModes:
        - ReadWriteOnce
      resources:
        requests:
          storage: 10Gi
      storageClassName: ocs-storagecluster-XXX
Grafana Replicas for High Availability
These replicas will share a PostgresSQL database according to the grafana-operator docs (here). One can immediately deploy a local Postgres database with Crunchy Postgres for Kubernetes from OperatorHub or Bitnami helm chart. Below is YAML showing how to set up the stored OpenShift secrets: PostgresSQL postgres-user and postgres-password, as well as the Grafana log in client-id and client-secret required when using auth.generic_oauth: for OpenID Connect (OIDC)
        env:
          - valueFrom:
              secretKeyRef:
                name: grafana-oauth
                key: client-id
            name: AUTH_CLIENT_ID
          - valueFrom:
              secretKeyRef:
                name: grafana-oauth
                key: client-secret
            name: AUTH_CLIENT_SECRET
          - valueFrom:
              secretKeyRef:
                name: postgres-grafana-cred
                key: postgres-user
            name: POSTGRES_USER
          - valueFrom:
              secretKeyRef:
                name: postgres-grafana-cred
                key: postgres-password
            name: POSTGRES_PASSWORD
          - valueFrom:
              secretKeyRef:
                name: postgres-grafana-cred
                key: postgres-db
            name: POSTGRES_DB
        name: grafana
replicas: 2
Add New Data Source for Dashboards
- Log in Grafana console (after creating an OpenShift route to, e.g., grafana-a-service at port 3000)
- Go to Connections → Data sources → + Add new data source
- Choose Prometheus (Note: It is not required to install VictoriaMetrics data source plugin because dashboards, especially those downloaded from Grafana Labs are largely based on Prometheus data source)
- Prometheus server URL: http://vmselect-vmcluster-example.grafana.svc.cluster.local:8481/select/0/prometheus
- Authentication: No Authentication
- TLS Settings: All unchecked
- Performance > Prometheus type: Prometheus. Prometheus version: in some cases, it may be required to select a version
- Save & test
(optional) Step 4 – Create VMAgent | VMStatic Scrape
3 networking services are automatically created after a VictoriaMetrics cluster is created. They are:
- vminsert-vmcluster-example: http: 8480 : TCP
- vmselect-vmcluster-example: http: 8481 : TCP
- vmstorage-vmcluster-example: http: 8482 : TCP | vminsert: 8400 : TCP | vmselect: 8401 : TCP
We should create one OpenShift route to the vmselect-vmcluster-example service to access the webUI vmui. The metrics are available e.g. https://vmselect-vmcluster.example.com/metrics. But each of the three different services does provide different set of metrics, for example, vm_vminsert_conns is only available in storage service. However, we only need to create one vmselect route and create a VMAgent from the operator to scrap all metrics. A sample of http://vmselect-victoriametrics-example.com/metrics below:
vm_filestream_buffered_read_calls_total 0
vm_filestream_buffered_write_calls_total 0
vm_filestream_buffered_written_bytes_total 0
vm_concurrent_select_capacity 4
vm_concurrent_select_current 0
vm_zstd_block_compress_calls_total 46
vm_fs_readers 0
vm_http_conn_timeout_closed_conns_total 1853
vm_available_memory_bytes 4194304000
vm_available_cpu_cores 2
Create VMAgent
Configure the VMAgent to use vminsert to write metrics into the VMCluster database with remoteWrite.
kind: VMAgent
apiVersion: operator.victoriametrics.com/v1beta1
metadata:
  name: sample
  namespace: victoriametrics
spec:
  extraArgs:
    memory.allowedPercent: '40'
  remoteWrite:
    - maxDiskUsage: 15GB
      url: 'http://vminsert-vmcluster.victoriametrics.svc.cluster.local:8480/insert/0/prometheus/api/v1/write'
  remoteWriteSettings:
    maxDiskUsagePerURL: 5GB
  replicaCount: 1
Create VMStatic Scrape for Grafana
Similar to VictoriaMetrics, a networking service called [grafana-a-service: grafana : 3000 : TCP] is created and an OpenShift route to it, e.g., https://grafana.example.com/metrics, will give Grafana related metrics. We create a VMStatic Scrape from the operator to ask VictoriaMetrics to scrape these metrics.
kind: VMStaticScrape
apiVersion: operator.victoriametrics.com/v1beta1
metadata:
  name: vmstaticscrape-grafana
  namespace: victoriametrics
spec:
  jobName: static
  targetEndpoints:
    - labels:
        env: dev
        project: operator
      targets:
        - 'grafana-a-service.grafana.svc.cluster.local:3000'
Check Scrape Success with vmui
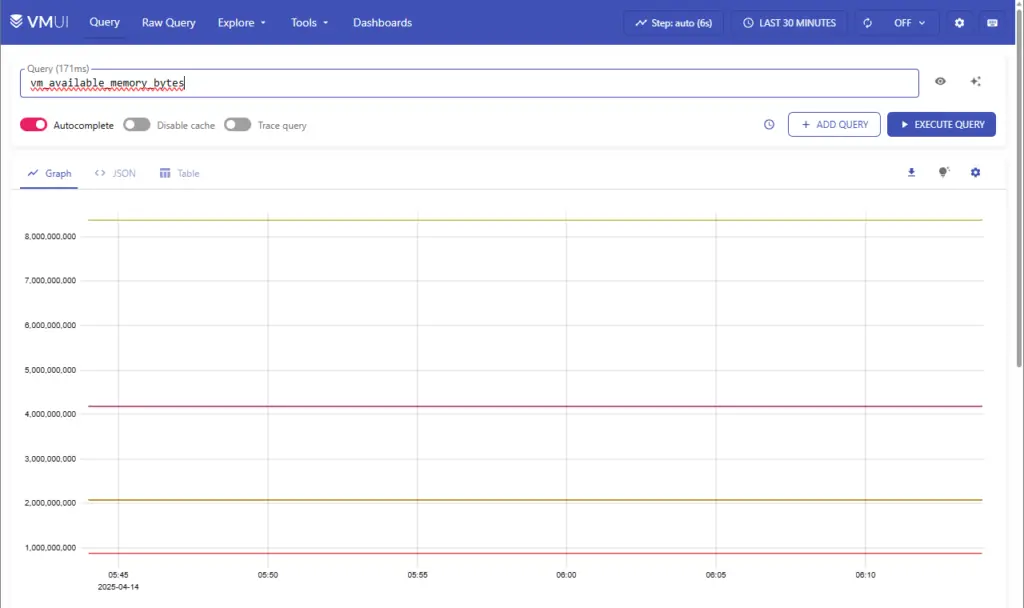
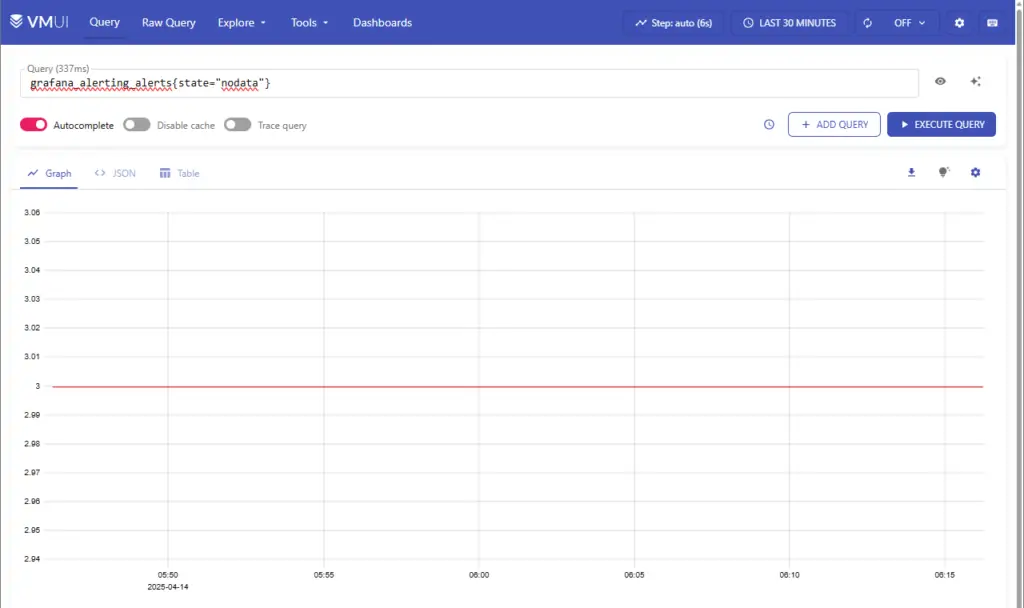
Click on Query in the top navigation bar to access the VictoriaMetrics built-in UI called, vmui. Execute VictoriaMetrics (vm_*) and Grafana (grafana_*) related queries and check the graph display.
Dashboards and Alerts
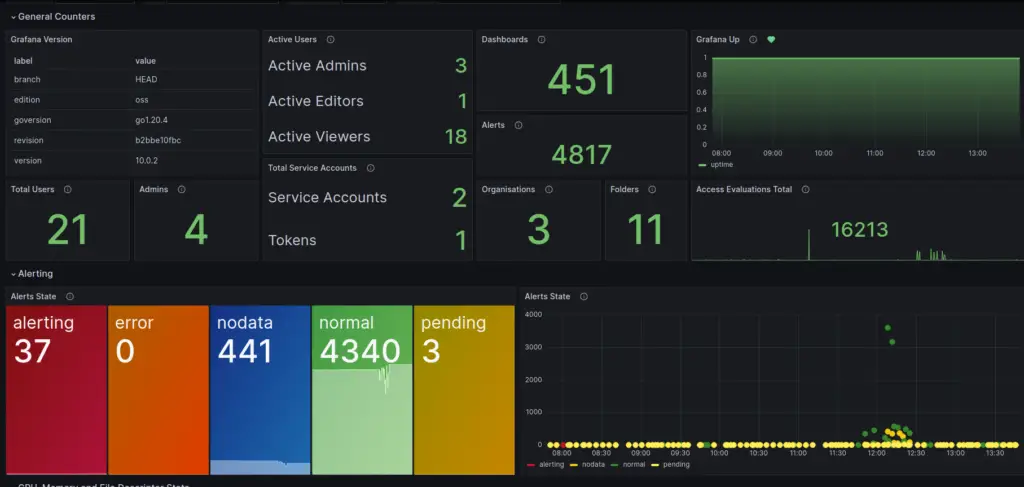
- Grafana Internal Stats dashboard – Overview total statistics of Grafana Server:
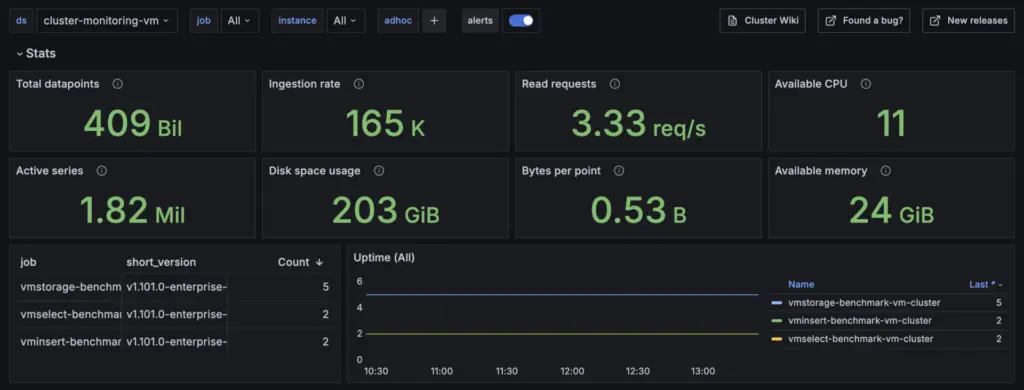
https://grafana.com/grafana/dashboards/20138-grafana-internal-stats/ - VictoriaMetrics – cluster – metrics displaying the current state and performance of the service:
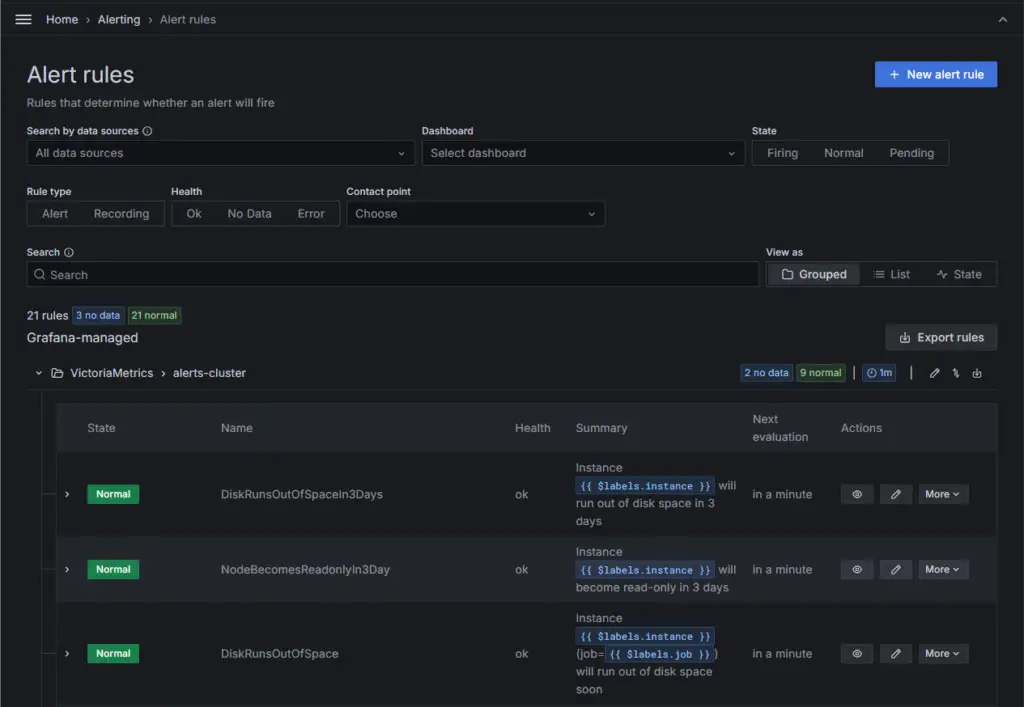
https://grafana.com/grafana/dashboards/11176-victoriametrics-cluster/ - To create VictoriaMetrics (cluster and health) alerts as Grafana alert rules:
https://github.com/VictoriaMetrics/VictoriaMetrics/tree/master/deployment/docker/rules
Conclusion
Prometheus plus the node_exporter metric scrapper and the built-in Alertmanager together with Grafana as a visualization tool are two popular open-source monitoring solutions. OpenShift default monitoring stack is based on Prometheus and nowadays, most SREs work revolve to some sort of containerized platform. With Grafana, the entire team can contribute to dashboard and alert creation via a user interface. If metrics retention is important to your organisation’s needs, then a time-series database like the VictoriaMetrics will fill the gap. It has its own arsenal of monitoring components, from single instance to VMCluster, VMAgent and VMAlert, and it even has its own VMAlertmanager. It is up to individuals to decide if they want Prometheus or VictoriaMetrics as a single solution or some other 3rd party monitoring app like Zabbix. What’s important is to find out what alerts to create from X metrics and the threshold to trigger alerts so that SREs can react to positive incidents.