Introduction
Relational databases, such as MySQL and PostgreSQL, are utilized to store diverse data types for web applications or analytical studies. You might be familiar with Redis, an in-memory key-to-value database for cache and message broker. Unless your applications have specific needs for fast data storage and retrieval, such as caching, chances are you will never have to install Redis. Otherwise, an application will put Redis as optional for optimal performance if under heavy usage. My work gave me the chance to set up a Redis cluster on OpenShift, so I’ll be sharing what I’ve learned.
Redis Architecture
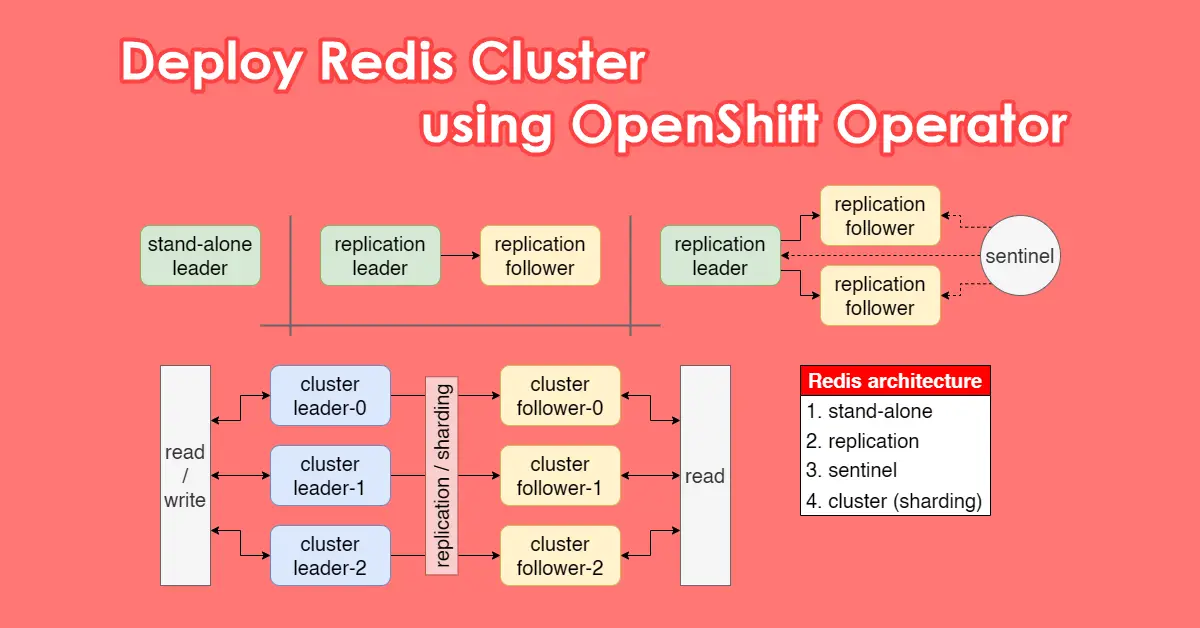
Redis can be used in three ways: standalone, replication, and sentinel.
- Standalone – Single database or pod acting as master and there is no health-check, HA, or replicas/salves. If the Master is unavailable, your application will be impacted. Do read and write to Master
- Replication means creating two databases or pods with one master and one slave. The program reads and writes to the Master, but only reads on the Slaves. Data is automatically async synced down from Master to slaves in one direction.
- Sentinel – three databases, with a master and two slaves, try to think of it as an upgrade over replication. Sentinel is a self-healing monitoring agent normally included when you select this architecture, and it will promote one of the two slaves to Master if the Master is down.
The Redis cluster is an entirely different beast. Redis cluster architecture is the best option for production and heavy utilization of Redis. It is made up of 3 replication pairs, master and slave, totalling to 6 pods in OpenShift. It works in such a way that follower-1 will sync with master-1 and so on.
- redis-cluster-leader-0 → async → redis-cluster-follower-0
- redis-cluster-leader-1 → async → redis-cluster-follower-1
- redis-cluster-leader-2 → async → redis-cluster-follower-2
Below is a sample pod log showing that replica-0 (redis-cluster-follower-0) has successfully synchronized with master-0 (redis-cluster-leader-0)
1:S 11 Dec 2024 04:27:49.312 * Connecting to MASTER 181.xx.xx.244:6379
1:S 11 Dec 2024 04:27:49.312 * MASTER <-> REPLICA sync started
1:S 11 Dec 2024 04:27:49.312 # Cluster state changed: ok
1:S 11 Dec 2024 04:27:49.314 * Trying a partial resynchronization (request d326xxxxxxxx:1).
1:S 11 Dec 2024 04:27:54.140 * Full resync from master: cca0xxxxxxxx:0
1:S 11 Dec 2024 04:27:54.141 * MASTER <-> REPLICA sync: receiving streamed RDB from master with EOF to disk
1:S 11 Dec 2024 04:27:54.141 * MASTER <-> REPLICA sync: Finished with success
Redis sharding is a method used to split the keyspace into 16,384 hash slots for key distribution across nodes covered by the 3 masters:
- slots:[0-5460] (5461 slots) master-0
- slots:[5461-10922] (5462 slots) master-1
- slots:[10923-16383] (5461 slots) master-2
Use redis-cli --cluster check redis-cluster-leader.<namespace>.svc.cluster.local:6379 -a password to ensure all 16,384 slots are covered.
$ redis-cli --cluster check redis-cluster-leader.redis-prod.svc.cluster.local:6379 -a password
>>> Performing Cluster Check (using node redis-cluster-leader.redis-prod.svc.cluster.local:6379)
M: e19ccxxxxxxxx redis-cluster-leader.redis-prod.svc.cluster.local:6379
   slots:[10923-16383] (5461 slots) master
   1 additional replica(s)
S: 54f1xxxxxxxx 181.18.27.193:6379
   slots: (0 slots) slave
   replicates 957dxxxxxxxx
M: 487bxxxxxxxx 181.18.33.195:6379
   slots:[5461-10922] (5462 slots) master
   1 additional replica(s)
M: 957dxxxxxxxx 181.18.29.227:6379
   slots:[0-5460] (5461 slots) master
   1 additional replica(s)
S: 157axxxxxxxx 181.18.45.139:6379
   slots: (0 slots) slave
   replicates 487bxxxxxxxx
S: 3ce1xxxxxxxx 181.18.47.237:6379
   slots: (0 slots) slave
   replicates e19cxxxxxxxx
[OK] All nodes agree about slots configuration.
>>> Check for open slots...
>>> Check slots coverage...
[OK] All 16384 slots covered.
Install Redis Cluster
There exist two methods of installing Redis cluster, namely by utilizing Helm charts to deploy Redis Cluster from Bitnami and Redis Operator from OpenShift OperatorHub.
Helm charts to deploy Redis Cluster from Bitnami
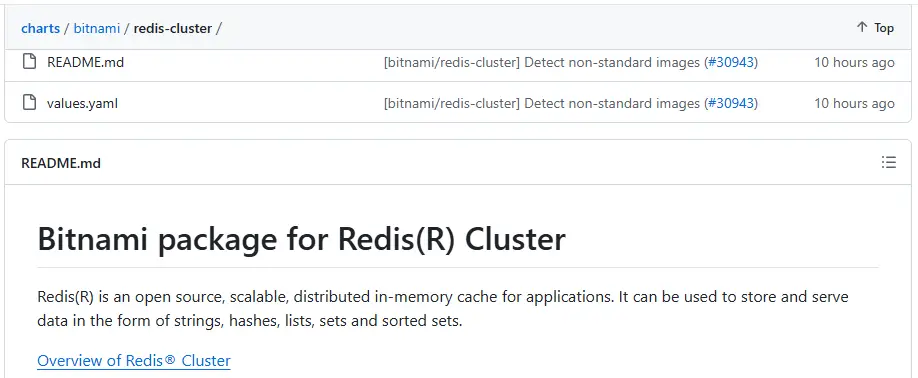
The helm chart method provides additional customization at your fingertips. All the configs can be modified at the values.yaml file, for example networkPolicy, service, podSecurityContext, tls and persistence etc. I actually like this method, but I got a stubborn SSL routines::wrong version number that made me try Redis Operator from OperatorHub instead. There is online documentation (README.md) for helm chart setup, as well as tutorials on how to deploy Redis Cluster on Kubernetes using helm chart. You simply need to replace kubectl with oc for the OpenShift environment. Since there is already a helm chart tutorial, I’ll talk about Redis Operator instead.
Redis Operator from OperatorHub
This is broken down into 2 phrases. First we install the Redis Operator and prepare the necessary cluster role binding and secrets. Second, we will create a Redis cluster from the Operator with some adjustable options within a form.
Phrase 1:
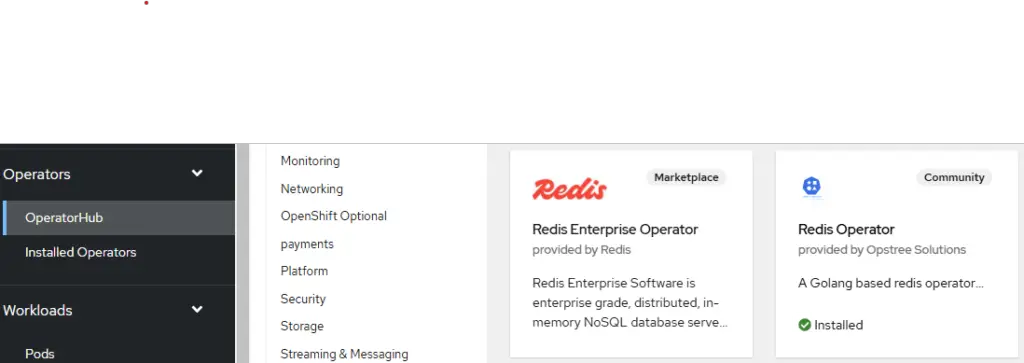
- Install Redis Operator from OpsTree Solutions from OperatorHub (Select stable version, manual approval, and single namespace)
- Because
ClusterRoleBindingcan only be applied to a single namespace, update 1xkind: ClusterRoleBindingsection per environment in cluster-role-binding-redisOperator.yaml oc apply -f cluster-role-redisOperator-v2.yaml|oc apply -f cluster-role-binding-redisOperator.yaml- Create key/value secret (name: redis-secret, key: password)
Phrase 2:
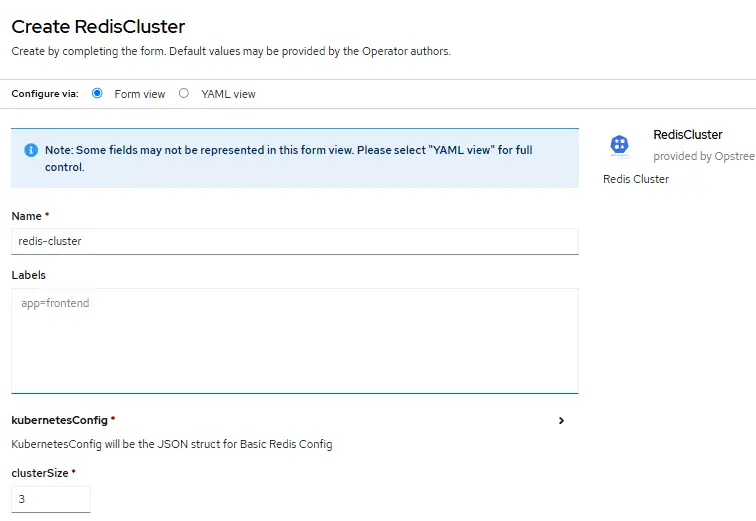
- Open Redis Operator and create RedisCluster (ref: https://github.com/OT-CONTAINER-KIT/helm-charts/blob/main/charts/redis-cluster/values.yaml)
- Update image from v7.0.5 to v7.2.6 (latest as of 5-Nov-24 from https://quay.io/repository/opstree/redis?tab=tags)
- redisSecret key and name from Phrase 1, Step 4
- serviceType=ClusterIP (NodePort if you need)
- clusterSize=3
- Uncheck persistenceEnabled (unless you need because Redis is an in-memory data store, )
- serviceAccountName=redis-operator (Upgraded privilege from Step 3)
- redisLeader.replicas=3
- redisLeader.pdb.enabled=true, redisLeader.pdb.maxUnavailable=(blank), redisLeader.pdb.minAvailable=2 (minAvailable and maxUnavailable cannot be both set)
- runAsGroup=1000
- runAsNonRoot=true
- redisFollower.replicas=3
- redisFollower.pdb.enabled=true, redisFollower.pdb.maxUnavailable=(blank), redisFollower.pdb.minAvailable=1
- storage.volumeClaimTemplate.spec.storageClassName=ocs-storagecluster-ceph-rbd (depends on your storage class specification)
- Update RedisExporter.image=quay.io/opstree/redis-exporter:v1.48.0 (latest as of 5-Nov-24)
- Manual update any resources limit and requests.
RedisInsight
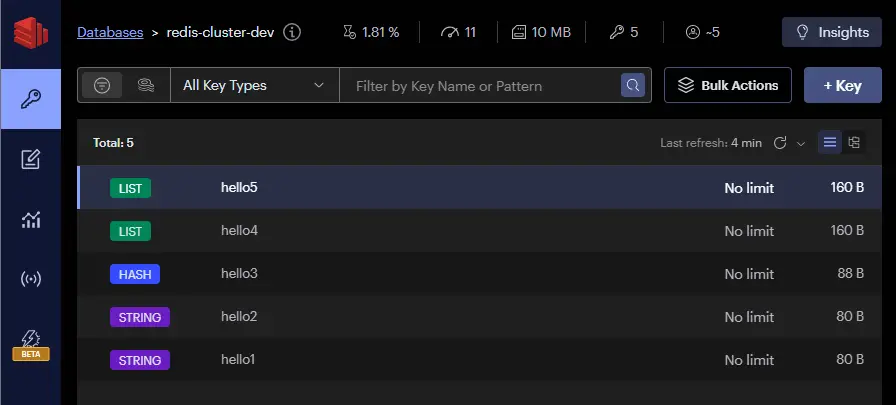
Having a graphical user interface is advantageous for evaluating various types of keys that can be legally generated in Redis. The database administrator can debug and troubleshoot if the Redis database has issues setting or getting key value pairs. While a developer does not normally have access to the database, it will be helpful for him/her to use the GUI to confirm that his or her codes are using Redis to cache data, as long as it can consume the keys correctly.
Redis Client as Debugging Workstation
Having a pod acting as a Redis client connected to the Redis cluster is for debugging and troubleshooting. Many redis-cli commands can be used to get information about the cluster state and the health of the nodes. The client can be used to test SET and GET key/value pairs. Although any one of the six pods can act as a client, it will be troublesome when certain pods need to be forgotten by the cluster, deleted and recreate to join back cluster when a cluster degrades. Below are the codes that were used to create a Docker image for the client and deploy it in the Redis namespace in OpenShift.
# ChatGPT
apiVersion: v1
kind: Pod
metadata:
  name: redis-client
  namespace: redis-prod  # Change to your Redis cluster namespace
spec:
  securityContext:
    runAsNonRoot: true   # Ensure the pod runs as a non-root user
    runAsUser: 1000      # Assign a non-root user, 1000 is commonly used
    seccompProfile:
      type: RuntimeDefault  # Use the RuntimeDefault seccomp profile
  containers:
    - name: redis-client
      image: redis:6.2.6  # Redis client image or any Redis CLI compatible image
      command: [ "sleep", "infinity" ]  # Keep the container running for interactive use
      securityContext:
        allowPrivilegeEscalation: false  # Disable privilege escalation
        capabilities:
          drop:
            - "ALL"  # Drop all Linux capabilities
        runAsNonRoot: true  # Ensure the container runs as a non-root user
        runAsUser: 1000     # Use a non-root user with UID 1000
        seccompProfile:
          type: RuntimeDefault  # Use the RuntimeDefault seccomp profile
      resources:
        limits:
          memory: "128Mi"
          cpu: "500m"
      imagePullPolicy: IfNotPresent
  restartPolicy: Always
Prometheus Redis Exporter for Cluster Metrics
After successfully establishing a Redis cluster in OpenShift and enabling the Redis exporter for Redis-related metrics, we may require the addition of a kind: ServiceMonitor to include the Redis cluster as a monitoring target in OpenShift Prometheus. To accomplish this, we implement the servicemoniotor.yaml file provided below.
# ChatGPT
apiVersion: monitoring.coreos.com/v1
kind: ServiceMonitor
metadata:
  name: redis-servicemonitor
  namespace: openshift-user-monitoring  # Use the namespace where your monitoring stack is deployed
labels:
  app.kubernetes.io/instance: k8s  # This matches your Prometheus instance label
spec:
  selector:
    matchLabels:
      openshift.io/cluster-monitoring: "true"  # Match the common label to monitor Redis services
  namespaceSelector:
    matchNames:
      - redis-dev  # Namespace where your Redis cluster services are deployed
      - redis-prod  # Second namespace
  endpoints:
    - port: redis-exporter  # This should match the port name in the Redis services (e.g., 9121)
      interval: 15s  # Scrape interval
  targetLabels:
    - app
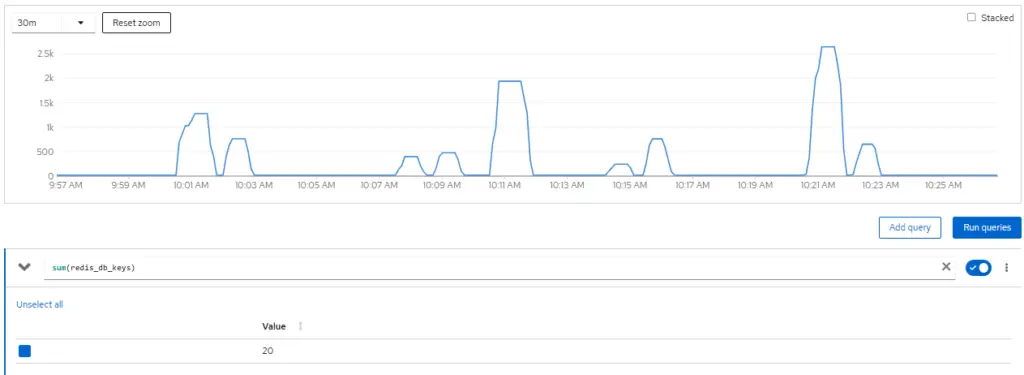
The 6 Redis cluster pods IP address should be listed in Observe > Targets under Endpoint along with Status, Last Scape, Scape Duration etc. After that, we can navigate to Observe > Metrics and use the Prometheus Querying Language (PromQL) to view Redis-related metrics.


Troubleshoot Redis
During a recent OpenShift outage, the Redis cluster in the production namespace recovered as per normal, but the cluster in the development namespace was degraded. In general, degraded Redis cluster nodes will not be capable of covering all 16,384 slots, indicating that the nodes are operating in isolation and key/value pairs can still be written to them. The redis-cli --cluster fix and redis-cli --cluster rebalance commands can be used to fix the Redis cluster. In more serious cases, it is still possible to resolve such issues by deleting the old cluster node details from the nodes.conf file to ensure only healthy nodes are added to redeploy the pods to rebuild the Redis cluster. Since there is no one solution for every situation, I will list a few useful steps I took to fix my recent cluster outrage.
# Use redis-client terminal to connect to Redis cluster
$ redis-cli -c -h redis-cluster-leader.redis-dev.svc.cluster.local -p 6379 -a password

# These redis-cli commands check for Redis cluster health
> INFO REPLICATION
> CLUSTER NODES
> CLUSTER SLOTS

# Check if all 16,384 slots are covered by cluster
# [ERR] if degraded
$ redis-cli --cluster check redis-cluster-leader.redis-dev.svc.cluster.local:6379 -a password
...
>>> Check for open slots...
>>> Check slots coverage...
[ERR] Not all 16384 slots are covered by nodes.

# Try these 3 commands for a Moderate severity case
$ redis-cli --cluster check redis-cluster-leader.redis-dev.svc.cluster.local:6379 -a password
$ redis-cli --cluster fix redis-cluster-leader.redis-dev.svc.cluster.local:6379 -a password
$ redis-cli --cluster rebalance redis-cluster-leader.redis-dev.svc.cluster.local:6379 -a password

# Critical severity case when above 'fix' and 'rebalance' do not execute successfully
# From any connected master node, remove failed nodes from > CLUSTER SLOTS
$ redis-cli -h 181.xx.xx.217 -p 6379 cluster forget <node-id>

# Re-add healthy nodes by removing nodes.conf
# nodes.conf stores (degraded) master/slave node-id and slot range
$ oc exec redis-cluster-leader-0 -- rm /node-conf/nodes.conf
$ oc exec redis-cluster-leader-1 -- rm /node-conf/nodes.conf
$ oc exec redis-cluster-leader-2 -- rm /node-conf/nodes.conf
$ oc exec redis-cluster-follower-0 -- rm /node-conf/nodes.conf
$ oc exec redis-cluster-follower-1 -- rm /node-conf/nodes.conf
$ oc exec redis-cluster-follower-2 -- rm /node-conf/nodes.conf

# From OpenShift, delete pods from StatefulSets to reconstruct Redis cluster
# Then, check leader and follower pods' log for cluster state

#  Re-check the health and configuration of the Redis cluster
$ redis-cli --cluster check redis-cluster-leader.redis-dev.svc.cluster.local:6379 -a password
...
[OK] All nodes agree about slots configuration.
>>> Check for open slots...
>>> Check slots coverage...
[OK] All 16384 slots covered.
Conclusion
You can choose a Redis cluster for heavy use or a replication/ sentinel architecture for light to moderate use. If you installed Redis cluster the Bitnami way, you have more configurations in values.yaml, but do go for OpenShift OperatorHub for quick convenient deployment using Redis operator. You can set up one of the free Redis GUI tools, like Redis Commander, to manage your Redis databases visually. It is recommended to use Prometheus monitoring by enabling the Redis exporter. This will help you keep track of metrics collected from redis_cluster_state, redis_master_link_up, and redis_memory_used_bytes. Go explore the different redis-cli commands available to check and remedy a degraded cluster, but this requires a better understanding of the Redis deployment.
The last post for the year 2024 concludes with me wishing you a Merry Christmas and a New Year filled with great vibes, good people, and good times.
TechSch.com webmaster
