Introduction
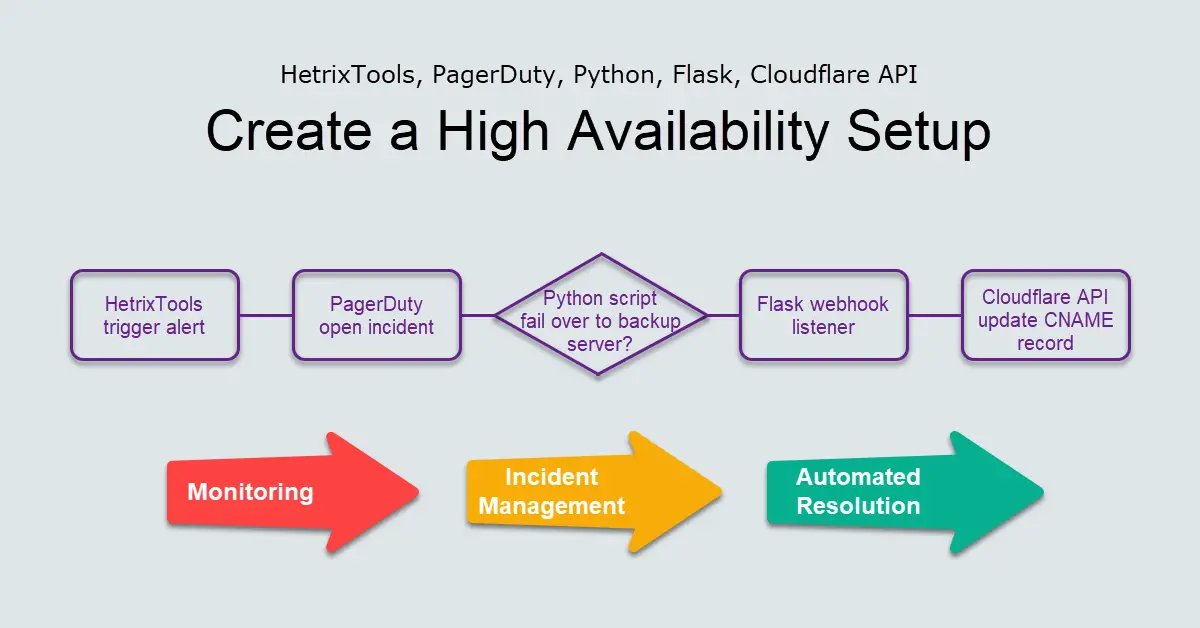
This tutorial will cover three things: Webhooks in Python with Flask, integrating PagerDuty with HetrixTools monitoring service, and using the Cloudflare DNS API with the cURL command. Python is one of the top programming languages for developers, and we will learn how to use Python scripting to make a call to the Cloudflare API. The webhook will be integrated into PagerDuty, a popular online incident management platform, to limit downtime incidents and reduce impacts to customers. Lastly, we will use HetrixTools monitoring service to trigger an alert to PagerDuty. The Mean Time To Resolution (MTTR) is the average amount of time it takes to fix a failure.
Background
As I was a full-stack PHP developer, I had zero interest in Python and tried to avoid picking up Python because I hardly had the need to use it as I could complete 90% of my required tasks with PHP. The only time I used Python was to use Selenium to scrape websites with Python. But my new job as a Site Reliability Engineer (SRE) requires Python to script automation, and I thought maybe it’s time to get started. I am also interested in learning more about PagerDuty, since I already use HetrixTools to monitor my VPS. We will connect HetrixTools with PagerDuty because PagerDuty is a tool for alerting people about problems.
Step 1 – Cloudflare
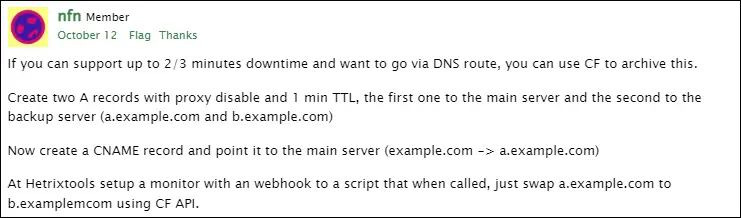
I was searching for something in the LowEndTalk community when I came across a thread about How to build a High Availability Nginx using two VPS. One of the replies (below) caught my attention because I was using HetrixTools to monitor the uptime of my server and Cloudflare as my DNS service.
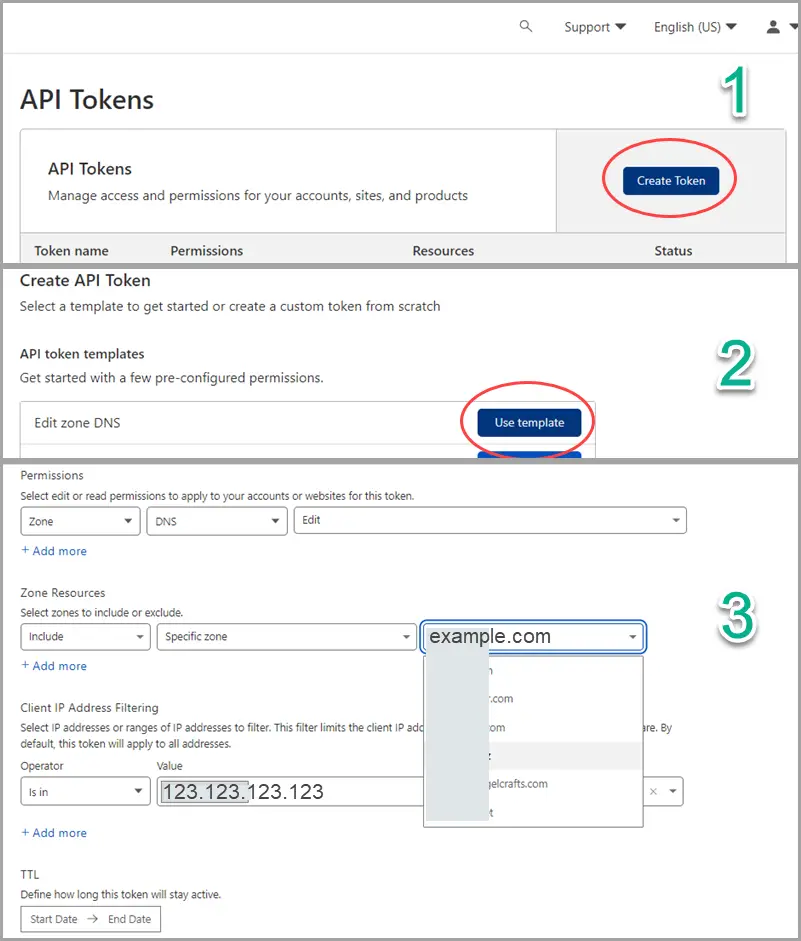
Step 1a – Create API Token to Update Specific Zone Only
You can use the Edit zone DNS template to create an API token. By following the principle of least privilege, we will choose a specific zone from the drop-down list of domains, and whitelist our webhook servers IP address (123.123.123.123) to Client IP Address Filtering for more security.
The API to update DNS records can be found here. Before we turn the cURL command into a webhook with Python scripting, we will test it in our Linux terminal to make sure it works with the correct API tokens and keys on our whitelisted webhook server.
$ curl -X GET "https://api.cloudflare.com/client/v4/user/tokens/verify" \
     -H "Authorization: Bearer <INSERT API token here>" \
     -H "Content-Type:application/json"
$ {"result":{"id":"daxxxxx94bf8aacxxxxx6e41ecxxxxx3","status":"active"},"success":true,"errors":[],"messages":[{"code":10000,"message":"This API Token is valid and active","type":null}]}
Step 1b – Find Zone and DNS Record ID
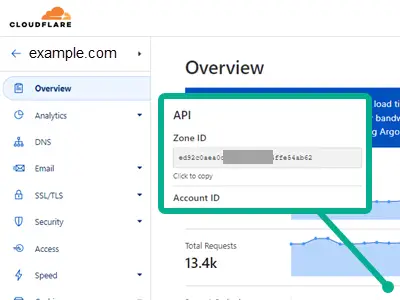
There is a Zone ID located at the bottom right of the selected domain Overview page for every domain name hosted by Cloudflare.
Next, we need to locate the DNS record ID for the API to update. The Zone ID (vUeC9tfMVqNyp5s5fHno) can be used in the cURL command below to find the DNS Record ID (QxYR2kE9tJvU0fct4b3N).
$ curl -X GET "https://api.cloudflare.com/client/v4/zones/vUeC9tfMVqNyp5s5fHno/dns_records?type=CNAME&name=example.com" \
>      -H "X-Auth-Email: youremail@gmail.com" \
>      -H "X-Auth-Key: XXXXXebbe0927XXXXX4ca793e575d8f0XXXXX" \
>      -H "Content-Type: application/json"
{"result":[{"id":"QxYR2kE9tJvU0fct4b3N","zone_id":"vUeC9tfMVqNyp5s5fHno","zone_name":"example.com","name":"example.com","type":"CNAME","content":"production.example.com","proxiable":true,"proxied":false,"ttl":1,"locked":false,"meta":{"auto_added":false,"managed_by_apps":false,"managed_by_argo_tunnel":false,"source":"primary"},"created_on":"2022-10-26T02:48:47.374981Z","modified_on":"2022-10-26T05:38:37.704961Z"}],"success":true,"errors":[],"messages":[],"result_info":{"page":1,"per_page":100,"count":1,"total_count":1,"total_pages":1}}
Step 2 – Python
Most Linux systems come with Python already installed. Use python --version or python3 --version to check. Pip is a package management system for Python. You can check if pip is installed by using pip3 --version, or you can use apt install python3-pip to install.
Step 2a – Install Flask as Webhook Listener
Flask is an HTTP endpoint webhook receiver that is easy to deploy on Linux. By default, Flask runs on port 5000 and http://127.0.0.01:5000/. If you get the FileNotFoundError: [Errno 2] error, first --upgrade pip before installing flask using the pip command.
$ pip install flask
FileNotFoundError: [Errno 2] No such file or directory: '/usr/local/bin/pip'

$ pip3 install --upgrade pip
    Successfully uninstalled pip-22.2.2
Successfully installed pip-22.3
$ pip install flask
Step 2b – Build a Python Webhook
In this tutorial, we will combine the Flask initialization code and the Cloudflare API code into a single Python script. Flask will listen for a URL subdirectory @app.route("/failover-backup"), such as http://123.123.123.123:5000/failover-backup. When this happens, the function failover_backup() will be called. Below is the cURL example provided by Cloudflare API v4 Documentation, and we will translate the equivalent of the command requests.put into the Python script.
curl -X PUT "https://api.cloudflare.com/client/v4/zones/vUeC9tfMVqN---Zone ID---yp5s5fHno/dns_records/QxYR2kE---Record ID---9tJvU0fct4b3N" \
     -H "X-Auth-Email: user@example.com" \
     -H "X-Auth-Key: YEGFk5P21JAGUhmloBbI" \
     -H "Content-Type: application/json" \
     --data '{"type":"A","name":"example.com","content":"127.0.0.1","ttl":3600,"proxied":false}'
import requests
from flask import Flask
headers = {'X-Auth-Email':'user@gmail.com', 'X-Auth-Key':'YEGFk5P21JAGUhmloBbI', 'Content-Type':'application/json'}
app = Flask(__name__)
@app.route("/failover-backup")
def failover_backup():
url = 'https://api.cloudflare.com/client/v4/zones/vUeC9tfMVqNyp5s5fHno/dns_records/QxYR2kE9tJvU0fct4b3N'
payload = {'type':'CNAME','name':'example.com','content':'backup.example.com','ttl':3600, 'proxied':False}
resp = requests.put(url, headers=headers, json=payload)
return resp.contentStep 2c – Test Webhook with Flask
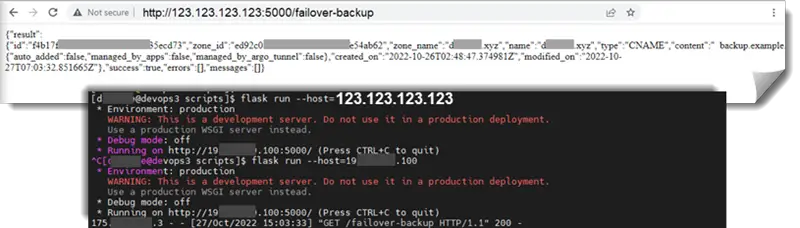
Below are the commands to run Flask to listen on the default localhost and public IP. In this tutorial, we will be using --host=<public IP> because we are tagging the webhook URL to the PagerDuty service. Remember that this public IP is already whitelisted in Step 1a.
$ flask run
 * Environment: production
   WARNING: This is a development server. Do not use it in a production deployment.
   Use a production WSGI server instead.
 * Debug mode: off
 * Running on http://127.0.0.1:5000/ (Press CTRL+C to quit)

$ flask run --host=123.123.123.123
 * Environment: production
   WARNING: This is a development server. Do not use it in a production deployment.
   Use a production WSGI server instead.
 * Debug mode: off
 * Running on http://123.123.123.123:5000/ (Press CTRL+C to quit)
To test, go to http://<webhook server IP>/failover-backup in a browser.
Step 3 – PagerDuty
Since the webhook is now working via the browser, we will need to apply it somewhere. PagerDuty is a multi-function platform that notifies its users of outages through an incident management dashboard. However, it is not a monitoring tool like Prometheus or Zabbix. We currently send the monitoring alert to PagerDuty after a condition/threshold is triggered.
Step 3a – Create a Service
You can sign up for the free plan on the PagerDuty website. There is no need to enter credit card details, so there is one less thing to worry about. To create a new service, go to Services > Services Directory > Click + [New Service button]


- Name: HetrixTools Monitor; Description: Remote uptime monitoring for the website and ping
- Select an existing Escalation Policy > Default
- Alert Grouping > Intelligent (Recommended); Transient Alerts > Auto-pause incident notifications (Recommended)
- Select integration(s) to send alerts to this service > API Fortress Connector
- Note down the Integration Key
For detailed steps, please refer to the HetrixTools documentation on PagerDuty Integration.
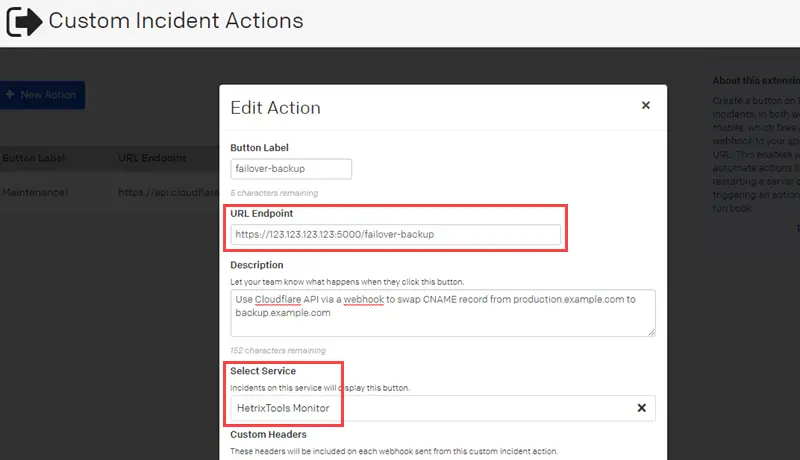
Step 3b – Custom Incident Actions (Webhook)
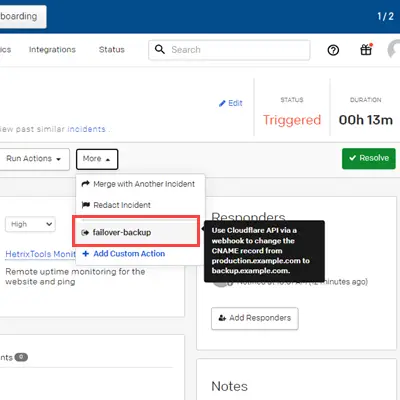
With custom incident actions, incident responders can quickly do something outside the PagerDuty system. This will create a button on PagerDuty incidents in both the web and mobile versions, which will fire a webhook to our specified URL. For example, actions could include restarting a server or doing something from a run book. Click the [+ New Action] button, enter a URL endpoint, and choose a service from the drop-down list. Otherwise, we could use runbook automation to make our incident response process simpler.
Step 4 – HetrixTools
I was aware of other free uptime monitoring services, such as UptimeRobot, and had used Pingdom and StatusCake in the past. I learned about the existence of HetrixTools in the LowEndTalk community and have since used it as my only primary uptime service for all my VPS. It is an easy-to-use tool for checking domain expiration, website status, and server uptime. It also offers free monitoring from various remote locations. The only downside is that you have to keep your HetrixTools account active by logging in to your dashboard at least once every 90 days.
Step 4a – Add PagerDuty Integration Key
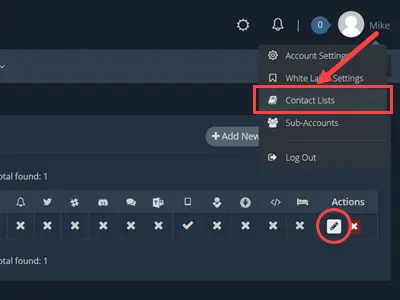
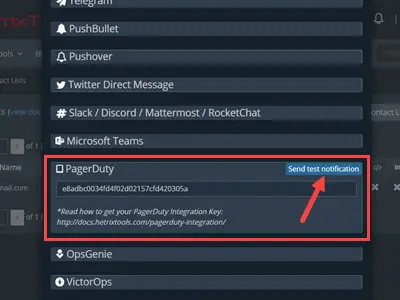
Paste the integration key generated from the PagerDuty service in Step 3a into HetrixTools Contract Lists > PagerDuty.
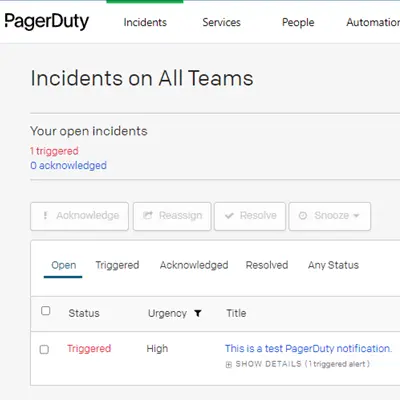
Step 5 – Simulate Alerting Workflow
To send a test notification, log in to HetrixTools > Contact Lists and click the [Send test notification] button under ‘PagerDuty’ in Step 4a. We will notice that a new open incident was triggered in the PagerDuty Incidents dashboard. Click into the incident and look for the webhook button under the More menu. You may hover over to read the description we wrote in Step 3b.
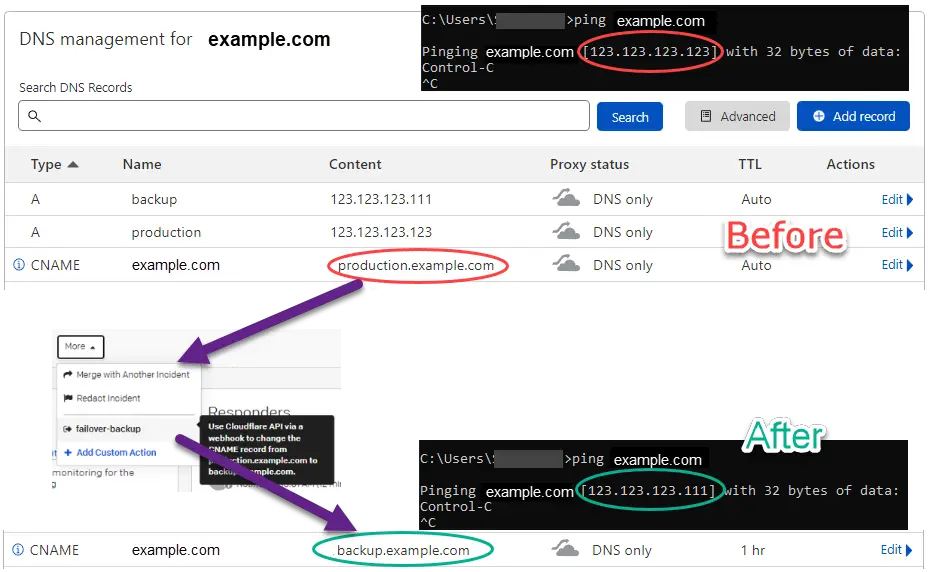
Step 5a – CName Record Before and After
- Production server IP: 123.123.123.123
- Backup server IP: 123.123.123.111
- CNAME: alias to Production server’s A record (before)
- CNAME: alias to Backup server’s A record (after)
When I performed a ping test from Windows Command Prompt to example.com, it showed that example.com reached the IP 123.123.123.123. However, after I clicked the Failover button at PagerDuty, the ping test showed that example.com reached the IP 123.123.123.111, which is the IP of the backup server.
Conclusion
The primary goals of this tutorial are to learn Python (scripting, webhooks, Flask), try out the Cloudflare API, and get acquainted with PagerDuty. Python is a good choice for automation scripting and browser testing with Selenium or Beautiful Soap. We implemented a Cloudflare API call by coding a Python webhook using Flask as a listener. PagerDuty is a popular incident management platform with many other features and built-in connectors to external monitoring hosts beyond simply creating a webhook. Monitoring and incident alerting, as well as the automation of manual response processes, helps operators preserve the high availability of our servers.